Paragon Options is a service that focuses exclusively on futures options. By doing so we are taking advantage of superior premiums compared to stock options and asset diversification offered by futures. Paragon Options is a directional options service that will focus on Metals, Energies, Bonds, Currencies, and Commodities. This service will launch on June 25th.
The Long Gold Futures Option Trade
This is an attractive long setup using futures options. On the bigger picture, Gold Futures (GC) is in an overall rising channel from the December 2016 low, and is close to rising channel support, currently in the 1280 area, as we are expecting a turn back up that I think should reach at least 1380-90, with Stan looking at a fib level in the 1410 area, and with rising channel resistance currently in the 1450 area.
$GOLD Daily Chart 3rd May PM:

The first entry was on Thursday 26th April, then an add-on 30th April, at 1317/8 and 1314/5 respectively on the GC June contract. GC broke down through the initial falling channel support to establish a lower channel support trendline in a wider channel which was unexpected but didn’t in any way invalidate the long thesis. The third and last long entry will likely be put on either after support is demonstrated on a retest of the 1302.5 low, or a clear IHS has formed and broken up, or GC breaks over falling channel resistance, currently in the 1336 area.
Stan has a fib level at 1296 and the bigger picture key support is rising channel support, currently in the 1280 area. A break below likely invalidates the long case on gold. GC Jun 60min Chart 3rd May AM:

Trade Setup
We are looking for a rise to around the $1360 level in Gold futures by the mid to end of June. This trade is current and live as of now. It was opened on the 26th April and so is only a week old. The underlying August future was trading at 1324. We then added to this position on the morning of the 30th April with the August future at 1321. The June futures options are priced off the August future so it is important and necessary to use this as the reference point for the trade.
We felt that Gold futures may go slightly lower initially but then that we would see a rally into the aforementioned $1360 level over the coming two months.
Jun/Aug 1330/1360 1×2 ratio call spread
We opted for a 1×2 call spread as it gave us a few features we liked. This is a purchase of a Jun/Aug 1330 call and simultaneous sale of two Jun/Aug 1360 calls. Firstly, gold vol skew is nearly symmetrical and so by selling 2 calls at 1360 we were able to get a good premium.
This enabled us to get a long theta (time decay) position, so every day this position is open we are collecting a premium as the theta burns. Secondly, the strikes were constructed in such a way to give us a slightly negative delta on the trade so that if the price of Gold did dip, we would not make a loss; in fact, we would make a small a profit. This would also give us exit options should we change our view on the direction of Gold.
The delta at inception was -9 or 9% of a futures contract, so very gentle but has the ability to turn into 100 delta or 1 futures contract. The structure of this position means that over time, the delta will flip positive and so will morph into the long position we want. This is to do with a second-order derivative called “Charm” on the 1360 leg but is a little too complex to go into here.
Let’s have a look at the P&L profile of this trade.
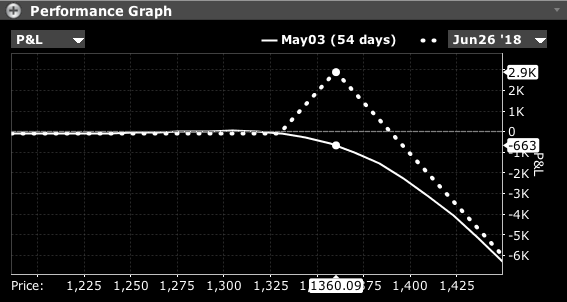
Here we can see how the position will behave immediately and also at the expiry (the dotted line).
The first thing to notice is the slight up-curve on the white line as the price of Gold futures falls, showing our small gain should Gold drop in the short term. This holds until around 1300 when we would go negative but we don’t see a dip of that magnitude as likely.
You will also then see the solid white line showing a loss of $663 per 1 structure should Gold go to 1360 overnight. We don’t feel this is likely and so we are more interested in the dotted (expiry value) line.
This shows the value of the position on the expiry day of June 26th. You can see there that a profit of $2.9k would be collected. It should be noted at this point that this trade was set up for a credit of $1.30 with the add going on for a credit of 50 cents. Therefore, a profit of $2.9k is a colossal return per 1 structure.
The risk at expiry on this position is above $1390 where you can see the dotted (expiry) line hits breakeven. Above here, we would essentially be short 1 call; again, we don’t see Gold going higher than $1390 by the June expiry as probable.
Summary
As this trade is live we don’t have a closing price and explanation to update you with as of yet. However, I can report that as of this morning the position is slowing a slight profit, trading at 0.50 from the -1.30 we set it up at.
As you can see this position is very different to the GBP/USD trade we placed and so demonstrates how we approach each trade with a blank slate and use a totally custom-made options strategy to reflect our view.
 03rd May 2018