I remember my father giving me an example a long time ago of the dangers of forecasting through extrapolation, and it was to imagine a man who had stepped off the top of the Empire State Building, and was overheard to murmur as he fell past the 51st story ‘So Far, So Good’. The point is that regardless of how well the first part of a plan develops, one always needs to consider the possibility that it may wander significantly off track by the end. We shall see how the rest of the plan for November develops. 🙂
I was saying in my premarket video this morning that I was expecting SPX to make an new all time high today, and while that might run a few handles higher, any new ATH should be marginal. So far that has delivered well.
Today’s Premarket Video from theartofchart.net – Updates on ES, NQ, RTY, DAX, ESTX50, SPX, NDX, RUT, CL, NG, GC, SI, HG, ZB, DX, EURUSD, USDJPY, USDCAD, AUDUSD, KC, SB, CC, ZW, ZC, ZS:
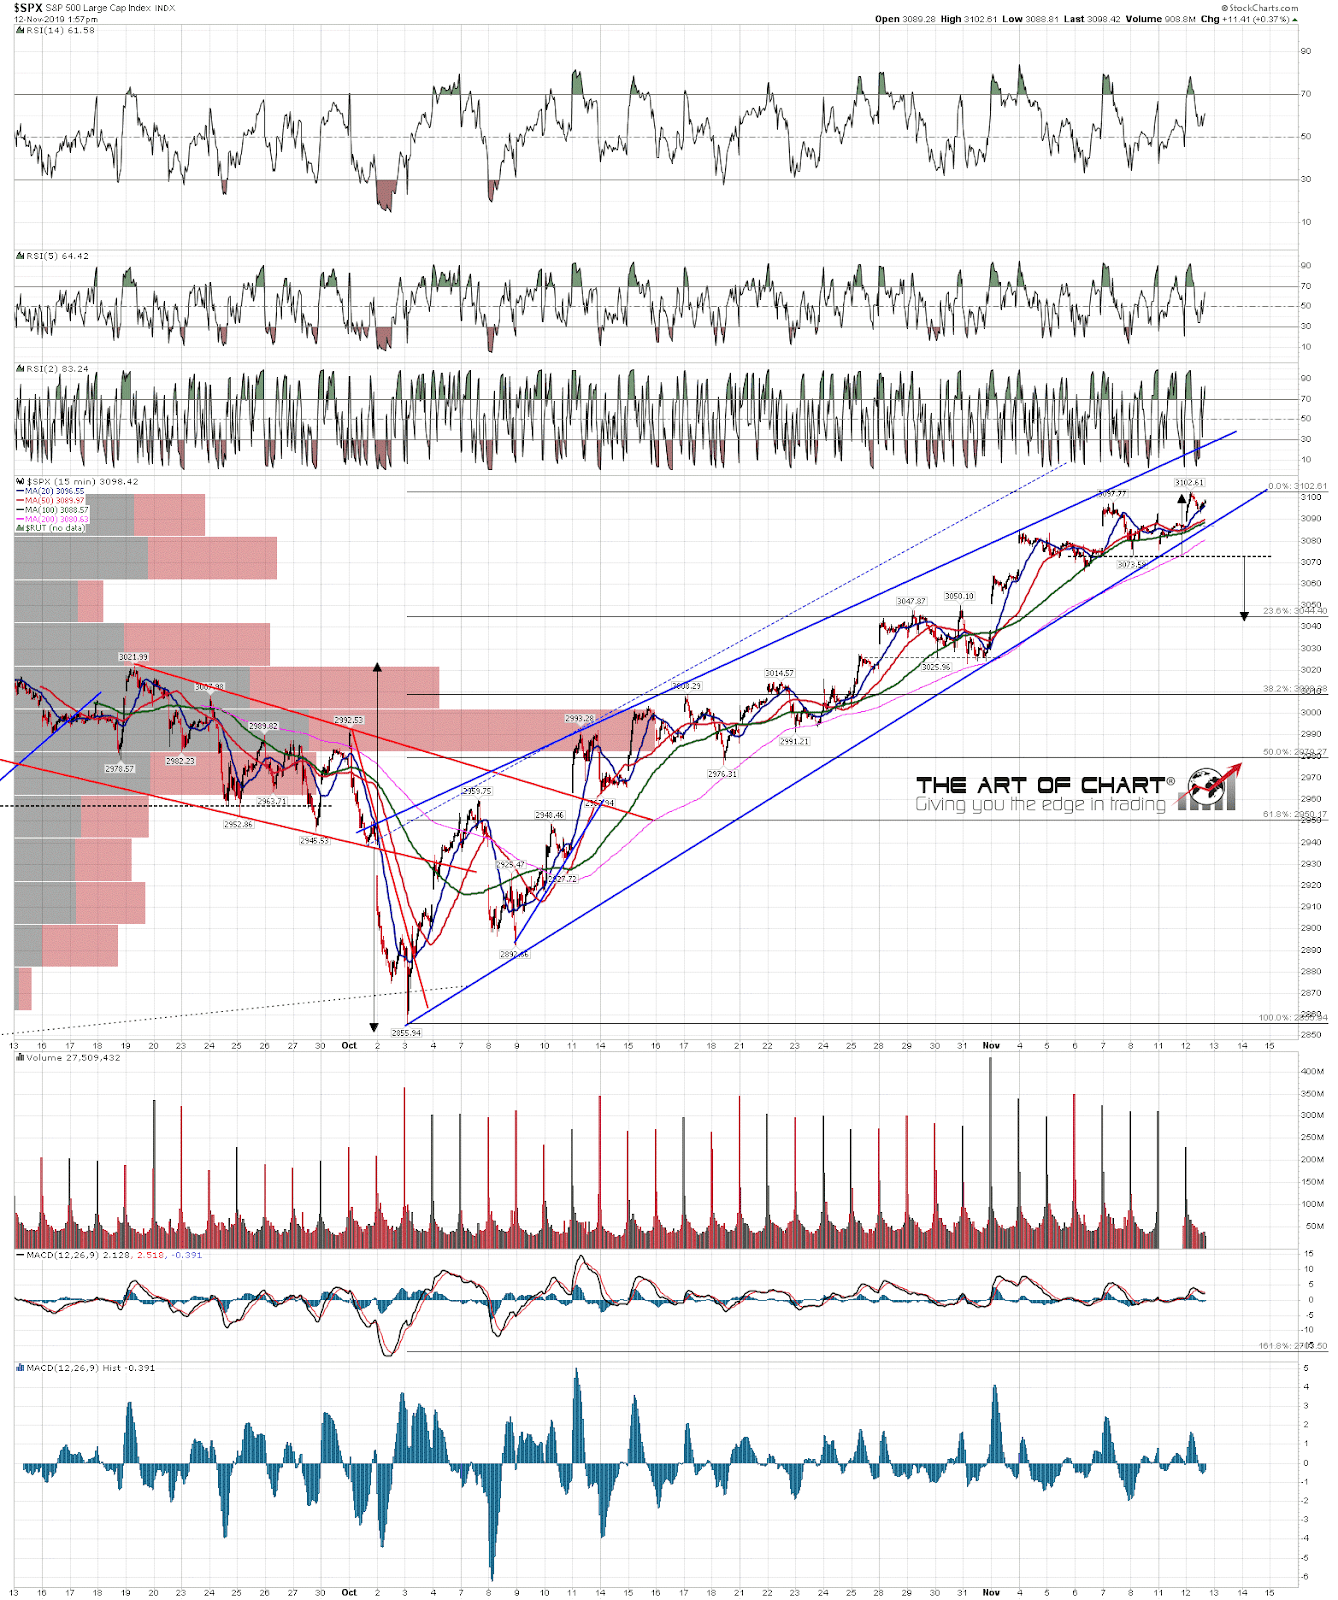
The reason I was expecting any higher high today to be marginal was mainly based on the short term rising wedge from the 2855 low, shown on the SPX 15min chart below. As SPX has not tested wedge support since the last test of wedge support, a direct move to wedge resistance was unlikely. Coupled with other factors such as divergence and cycle expectations this is a very good place to be looking for the sharp retracement that would usually precede the more significant high that we are looking for later this month. Since I capped this chart, that rising wedge has been duly tested and has broken down.
SPX 15min chart:
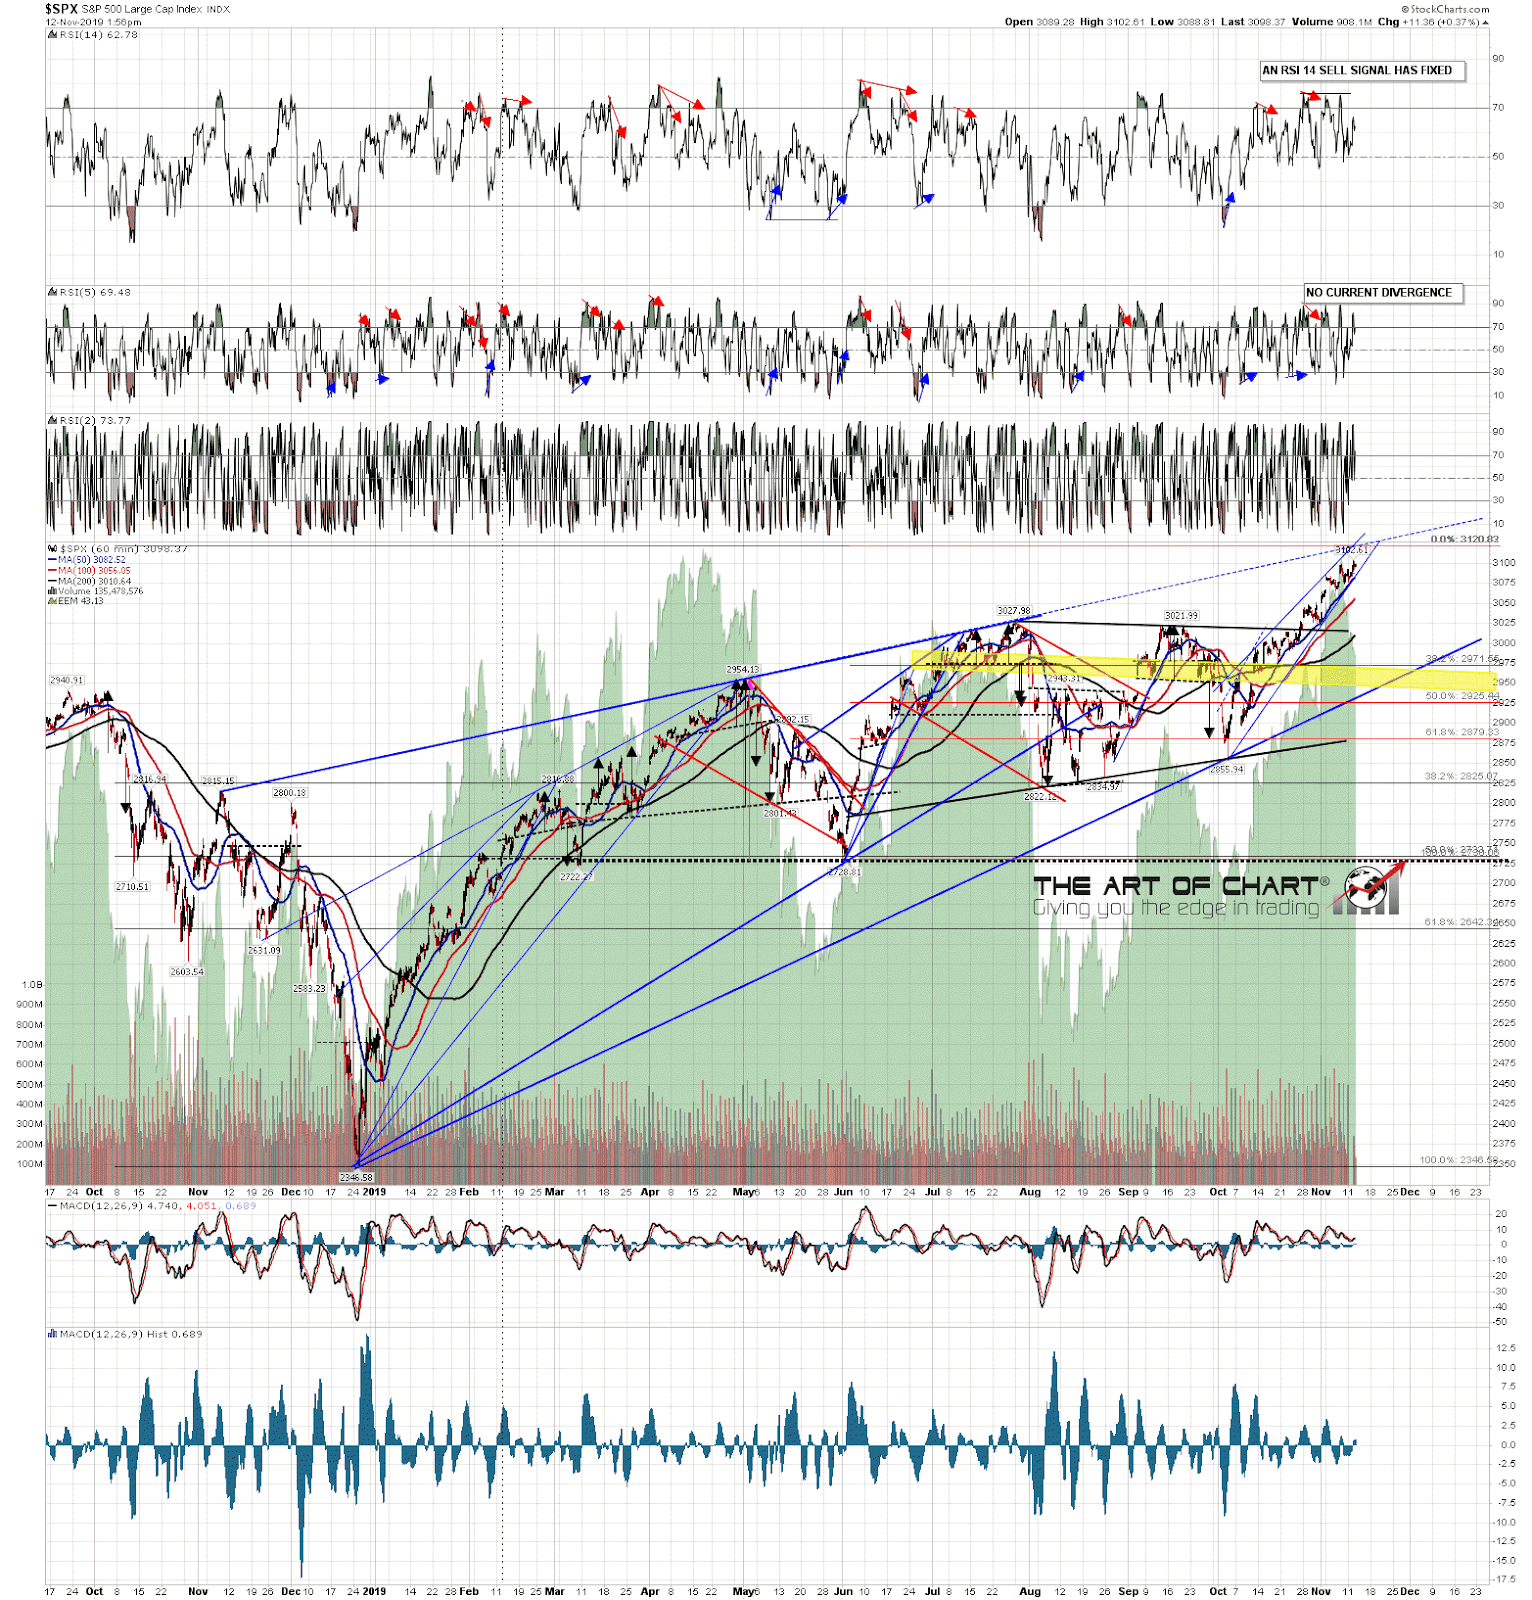
On the SPX 60min chart, , if there was not already an RSI 14 sell signal fixed, then another high quality sell signal would be brewing now and close to fixing. The key supports that I am watching now are the weekly pivot at 3083.5, supported by the key 50 hour MA, currently at the same level. A break and conversion of these to resistance opens the downside for that larger retracement and I am watching that with great interest. The 50 hour MA is the key short term support level I watch on SPX and since SPX broke back above that in the 2920 area it has been support for the three significant retracements since then, not being significantly broken any of those times. If it holds as support here then that would set up another possible all time high retest next. If it breaks and converts to resistance then I would expect at least a test of the daily middle band.
SPX 60min:
The daily middle band is currently in the 3042 area, and if in turn that is broken then that opens up the main target areas for this retracement and these are the fibonacci retracement targets that I would normally expect to see on a break down from a rising wedge like the one on the 15min chart. Those target areas are the 38.2% target in the 3010 area, or the 50% (only an honorary fib level) target in the 2980 area, or the 61.8% target in the 2950 area. In this case I’m mainly looking at the 38.2% and 50% targets as the most likely.
I’d note the decent quality RSI 5 and NYMO negative divergence on the daily chart that is setting up the daily sell signal that could very much put those targets in play once that is fixed.
SPX daily chart:

After this retracement SPX should then make a new all time high and I have the ideal trendline for that marked on the hourly and daily charts, currently in the 3120-5 area but rising gently of course over time. That would likely be in the 3125-30 area by the end of November.
If you missed our monthly public Chart Chat then you can see the recording on our November Free Webinars page here. I’d also mention the FAANG stocks and key sectors webinar that we are doing after the close on Thursday next week. You can register for that on the same page if you are interested.
 12th Nov 2019
Nice calls as always, Jack. Thank you.