My last few posts have been a coronavirus COVID-19 series, so I’m putting in the links here so as to refer back to them easily for now. These are the four posts so far.
18th February – Peering Through The Fog Around Coronavirus COVID-19
24th February – Some Genuine Coronavirus Numbers Coming Through
28th February – Falling Down The Steps
9th March – A Tale Of Two Cities
There has been a lot more news on coronavirus and unlike on Monday, there don’t seem to be many people left arguing that this decline is all about an oil price war. Trump’s speech last night has been cited as the likely cause of the overnight slide on equity futures and that may be partly right, you can see an analysis of that speech by CNN here. There has been a lot of other coronavirus bad news over the last couple of days though, including the WHO finally declaring this a global pandemic, the UK health minister being diagnosed with COVID-19 on Tuesday night, the news that the Italy Health Minister died of it yesterday, Poland essentially shutting the country down in terms of tourism, bars, restaurants, social events and travel yesterday as well, and other countries planning to follow suit shortly. COVID-19 is now front and centre in the news everywhere, and the extent of western governments’ failures to either prepare for a problem like this, or respond early enough to this problem, is becoming increasingly obvious. I’ve never had much confidence in any governments really but even I am shocked at how badly they have delivered here, and the US government, that I had assumed would be leading the world response, is still trailing far behind most others, though it is at last waking up to the scale of the problem:

So what does this mean for markets? Well the first thing I’ll say is that the 2500 target that I gave for SPX in my post on 24th February has been tested this morning, which was a lot faster than I was expecting on 24th February. So far that support is holding, with the SPX low today at the time of writing at 2500.65. This is an area that I was thinking might be the retracement low, and while that seems much less likely now, it may still deliver a decent bear market rally.
SPX weekly chart:
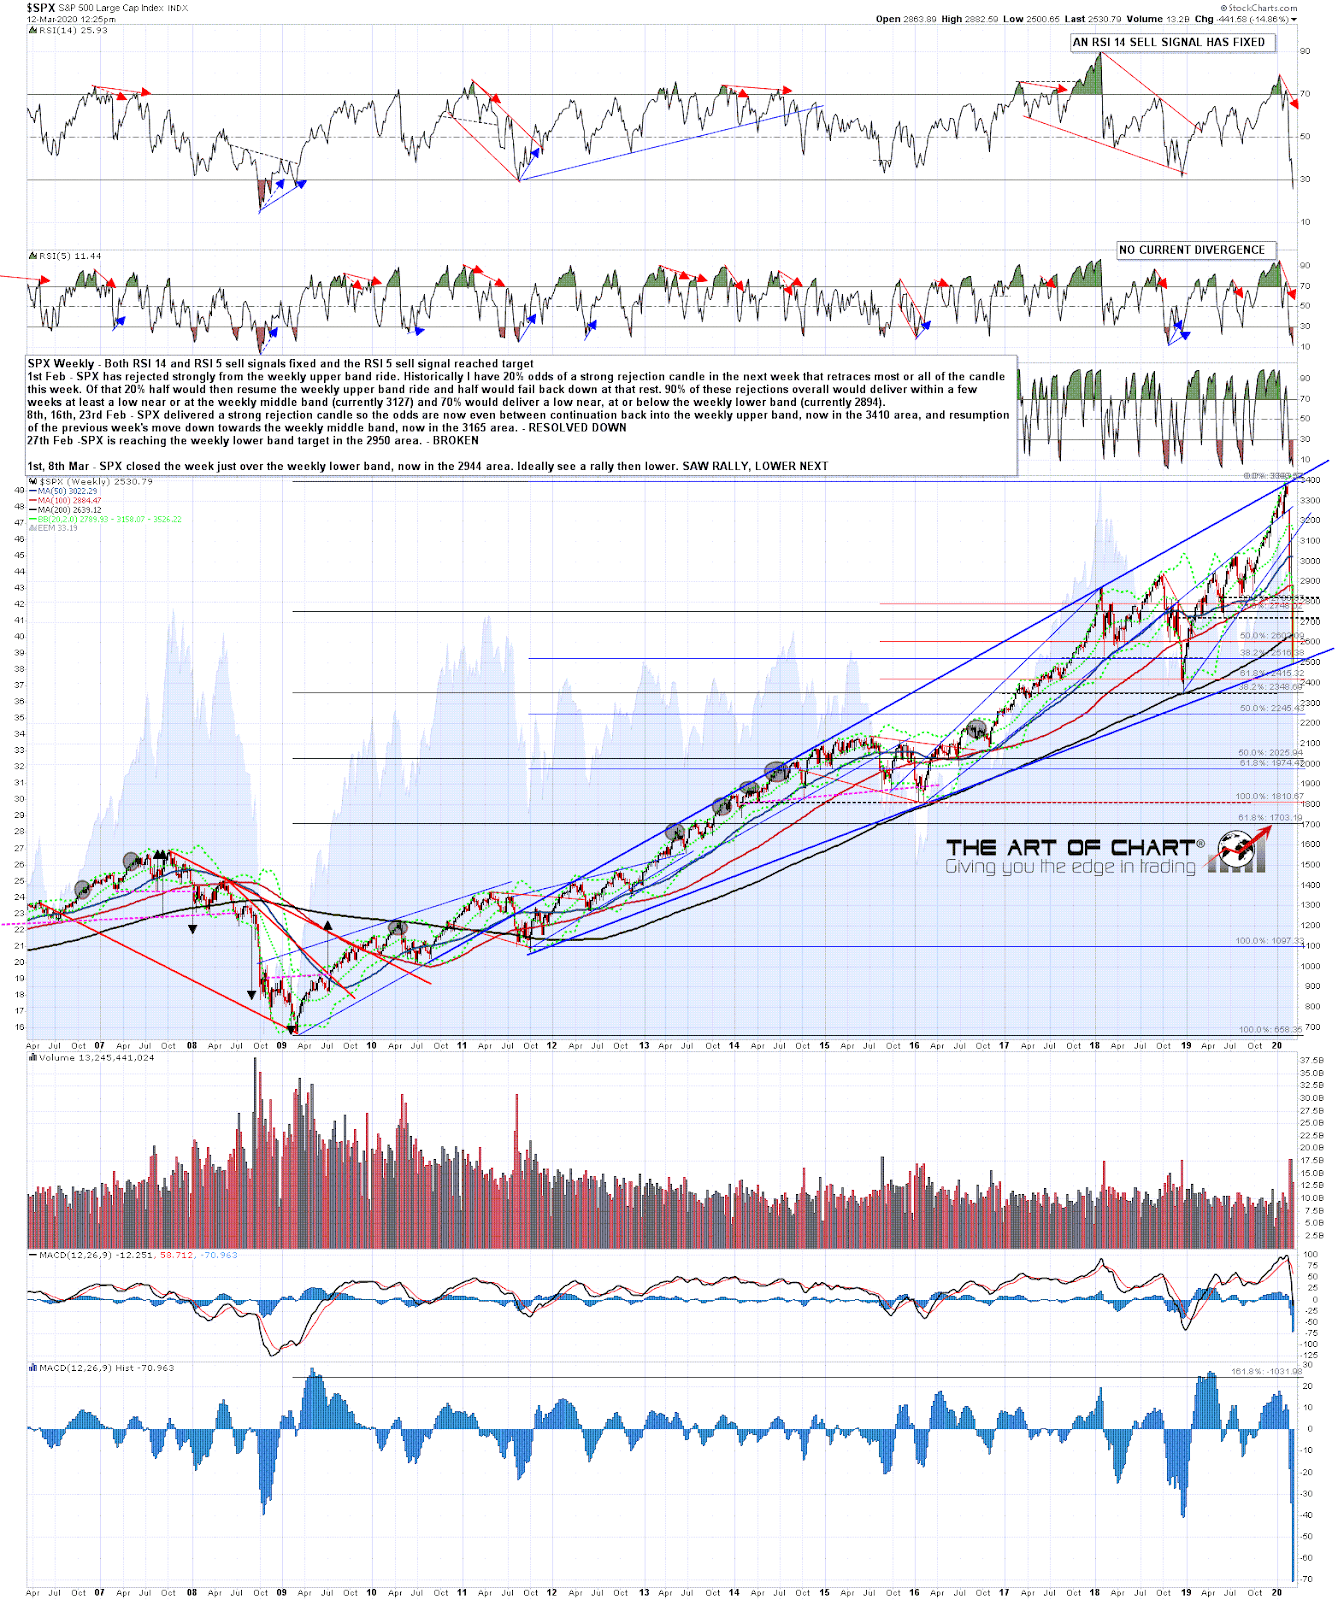
If 2500 then breaks either now or in the next few days, that would open up the next big support area in the 2350 area, with the December ’18 low and the H&S target both at 2346.58 and rising support from the 2009 low in the same area.
SPX daily chart:

In the meantime this has been a fun market to trade and there can have been few better places to trade it than on the subscriber-only twitter feed at theartofchart.net. We’ve done a lot of very nice calls there over the course of this decline, and I’ve put three of those from yesterday and today on the chart below. You can get free access to that for a month just by signing up for a 30 day free trial at theartofchart.net on this page here. That gives you access to most of our analysis and particularly our subscriber only twitter feed where we post our intraday updates and targets. The trial is free for 30 days, at the end of which you can either cancel with no obligation or subscribe to one of our services. Just sayin’.
SPX 1min chart:
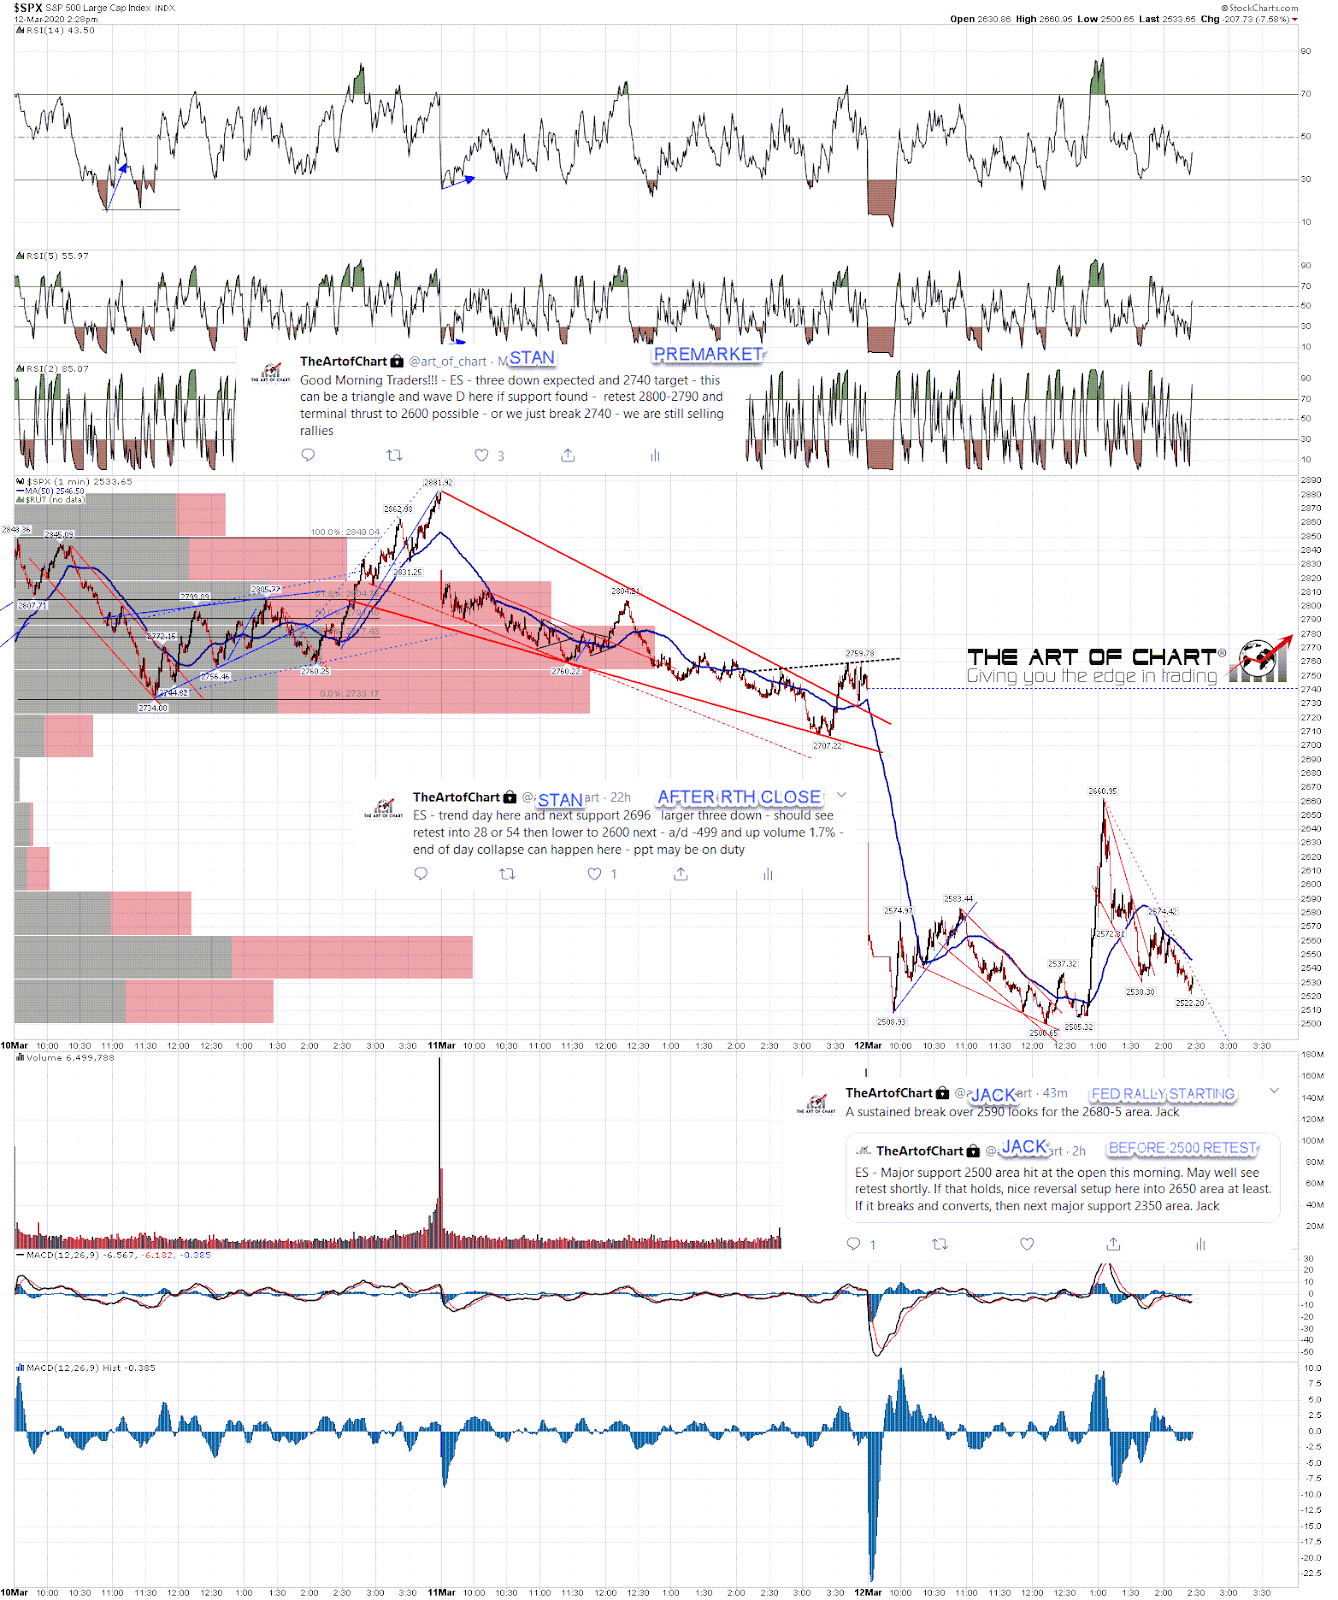
UPDATE – At the close today there was a slight break of that 2500 support trendline. SPX might well deliver a bear market rally next but after that ends all eyes should be on the next target and even bigger support area in the 2350 area. Will that hold? Maybe, but as I’ve been watching this decline I’ve been thinking that while the bad news on COVID-19 has now definitely made a serious start, it looks likely to be a while before either the bad news or the virus peaks. The earliest serious estimates I’ve been seeing for this pandemic to peak are in April, maybe, and a really strong buying opportunity on equities may well be after that, so we’ll have to see.
 12th Mar 2020