
Just to start I want to state a clear health warning for the historical stats I’ll be weighing at the start of this post. This stats can give a useful lean, but even an 80% bullish lean still assumes 20% odds that the market closes higher that day, and this lean in either direction does not carry with it any indication of how far up or down markets might close. That said, as a tool in the technical toolbox these are always worth looking at in my opinion, and often deliver decent results.
In my intraday video on Thursday and my premarket videos on Friday and this morning at theartofchart.net I was looking at the historical stats for those days and for this week and proposing a possible course that SPX might take into the end of this week.
The historical stats for Thursday and Friday leaned 57.1% green, with the stats for today at 66.7% green, and I proposed that I would be looking for a double top setup to continue to form, noting this morning that the high retest that wasn’t quite reached on Friday should be made today, ideally after an AM low which we saw in the first hour of RTH (regular trading hours). Ideally that higher high would be marginal to leave an ideal nested double top setup.
At the end of today the historical lean would change and we might then see a significant reversal. The lean for Tuesday this week is only 19% green, making it one of the most bearish leaning of the year, and the historical stats for the rest of the week all lean bearish, albeit less strongly, at 38.1%, 42.9% and 47.6% green closes respectively. If the market follows the historical stats then there is a very nice looking topping setup at the moment, though that will be deteriorating a bit at SPX continues to go higher, so ideally SPX would stay under 3265 or so today.
So what are the three theoretical bears that i am referring to in the title today? Well at the moment this is a very nicely formed triple nested double top, with the smallest double top support at 3198 looking on a sustained break below for the 3155 area, then the medium double top support at 3127, with a target in the 3010-30 area.
SPX 15min chart:
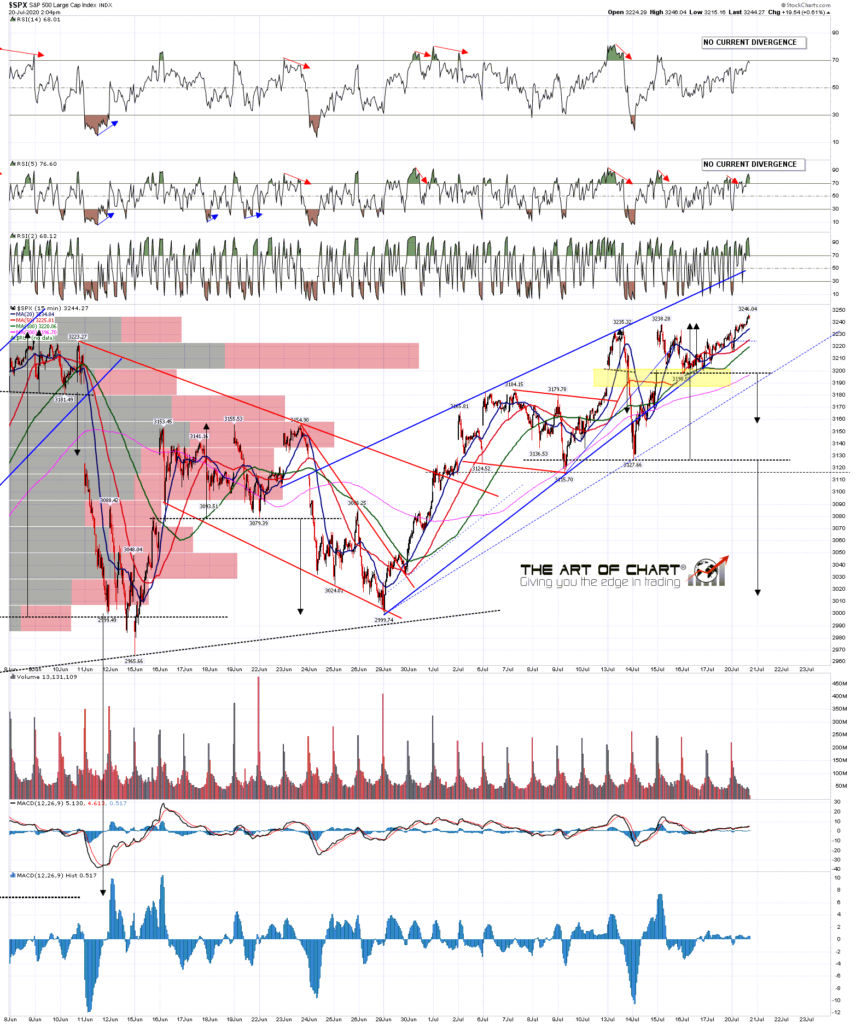
The third and largest double top setup has support at 2965 with a target in the 2590 area. Signals are promising with both hourly RSI 14 and daily RSI 5 sell signals already fixed, though a strong close today could kill the daily sell signal.
SPX 60min chart:
![]()
The first big support level is the daily middle band that has held as support on the last two retracements, with that currently in the 3144 area. On a break below that would open possible tests of the 50dma, now in the 3075 area, and the 200dma, now in the 3035 area, and close to the targets for the medium double top setup.
SPX daily chart:

Is there an alternate bullish scenario? For sure. On a hard break higher from here the obvious wedge resistance trendline target, shown on the 15min chart, is currently in the 3290 area, and that’s another reason that I’d be concerned if SPX continues to grind higher from here. We”ll see how that goes.
A couple of announcements today. Stan and I are doing our month free public webinar looking at FAANG stocks and sectors an hour after the close on Thursday. If you’d like to attend you can register for that on our July Free Webinars page.
Secondly we are running another Traders Boot Camp at theartofchart.net starting on 3rd August teaching technical analysis and trading skills. These are mainly aimed at existing subscribers but are open to all and are comprehensive, include a lot of useful trading tools, and very cheap relative to an equivalent courses that I have seen online. If you are interested you can read more about that here.
 20th Jul 2020