Bonds are a technical trade. If you have a decent approach to technical analysis, you can make money on a consistent basis trading Bonds. On Chart Chat every Tuesday (our video review of the markets), Jack and I compare notes each week across a number of charts. Our Bond work has been absolutely impressive. We were each pretty good but together we are a force to be reckoned with.
Following up on Jack’s post, Bonds, A Summer Projection I am including a few charts and levels to support the summer trade.

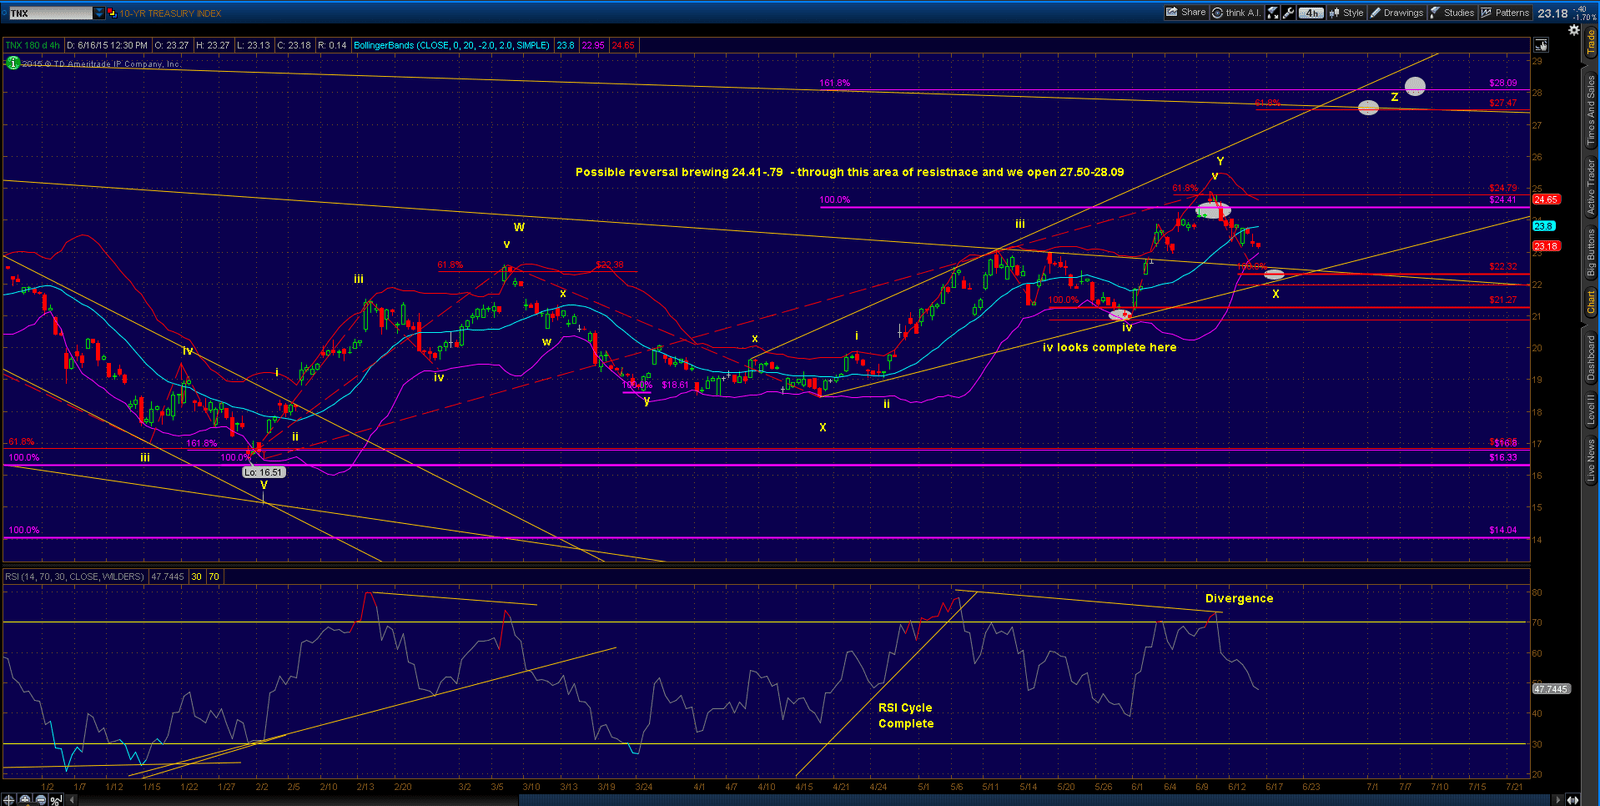
TNX – the 10 year treasury index, 4 hour chart – So far we have a change in trend from the 16.51 low and have completed a W-X-Y pattern and are into a retrace down into the 22.32 area. From there, if the rising support trend line holds from 18.69, I am expecting a push higher into 27.47-28.09ish.? Clear divergence exists and a deeper pullback is possible so watch that trend line. I use TNX a lot as I usually try to find the easiest Index for Bonds to begin my work. It gives clear hints – : )

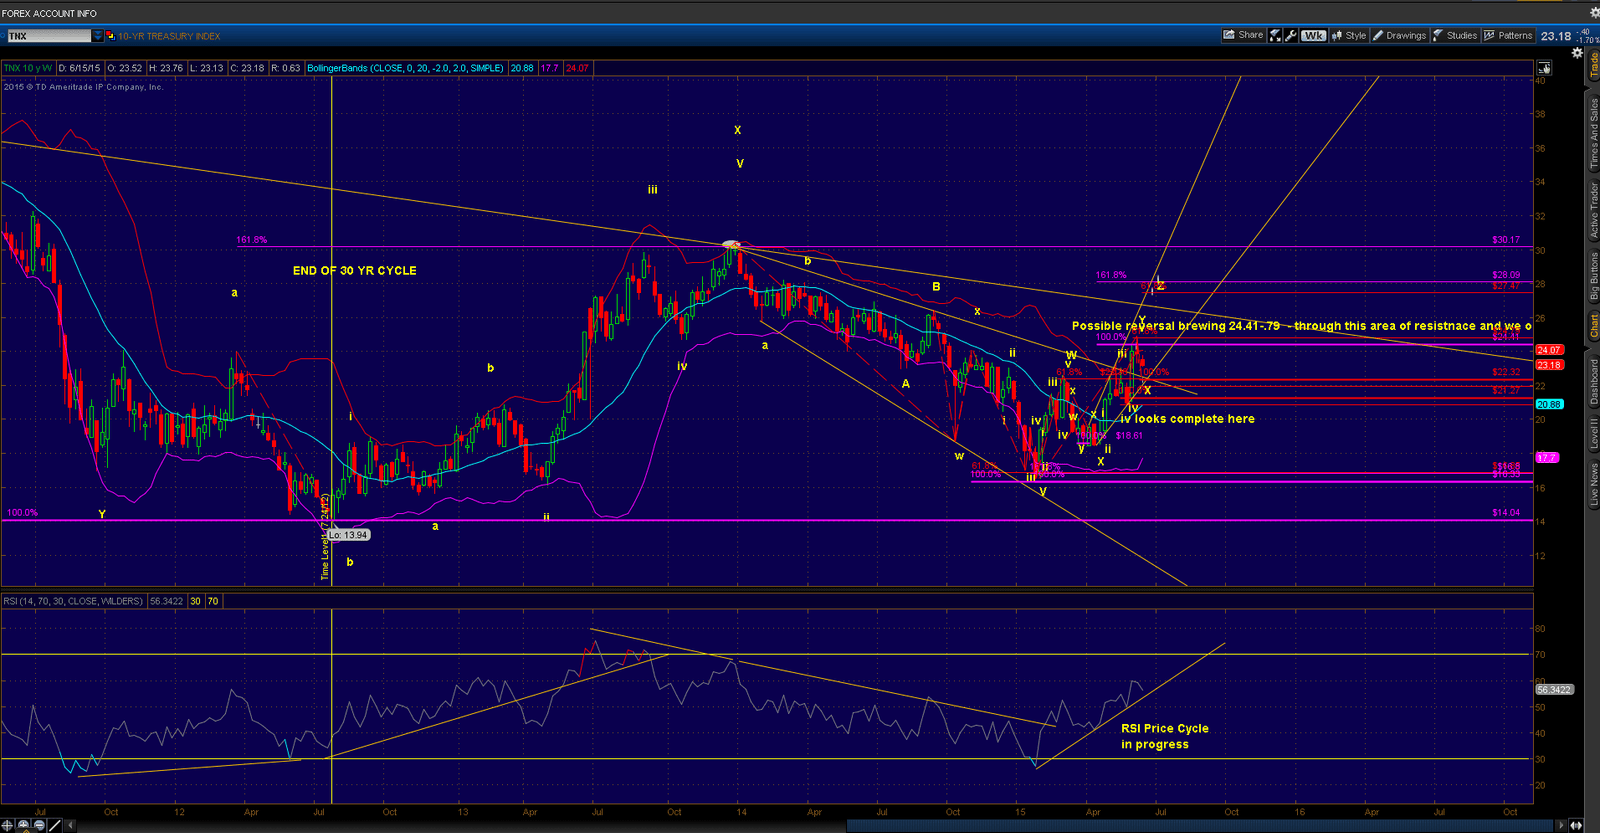
A longer term view of TNX – simply showing the? end of the 30 year cycle back in July of 2012. The low is in and higher prices?are in store?for a long time to come. Bond cycles are not short term in nature. Note the weekly RSI Price cycle is still? in progress.

TLT (20+ year Treasury ETF) Hourly Chart shows a clear impulse from the high from Feb 3rd. So far 3 waves down to our target of 115.34 with very clear divergence.?The 4th wave should see 121.67ish area and possibly higher to the declining resistance trend line. From here, lower to our 5th wave target in the 107.50ish area. Cycle chart says low window for this?5th wave?is roughly 7/26/2015 as a center date and it can extend into August. We will keep you posted as this trade develops this summer.
 16th Jun 2015
Maintain the spectacular work !! Lovin’ it!|