The Trump Stock Market Rally is coming to an end. Donald Trump’s election victory has been credited by the media for the late 2016 – early 2017 rally in stocks. Some investors speculate that the new president’s tax and regulatory reforms, along with anticipated infrastructure spending, have spurred a wave of euphoria on Wall Street. I hate to disagree with the media but unfortunately the rally would have occurred no matter who was elected into office based on the price structure and timing cycles of the S&P 500 index.
What is coming to a head is a significant decline in the S&P 500 and an end to the Trump Stock Market Rally. This is likely to be called the Trump Slump or even the Trump Dump, but I’ll leave it to the media to come up with the next catchy slogan. Timing cycles and price are coming into alignment in the next few weeks which will cause a decline into the July time frame. The top has yet to fully formed but a target of roughly 2000 in the S&P 500 is possible by then. I am expecting a V year in 2017 with a rally in the latter half of the year. Once that rally completes, I am expecting a recession in 2018 and 2019 and a much larger decline.
The last time I made a post like this was on June 19th, 2015 where I was discussing the turn in the S&P 500 and forecasting 1820 as a target based on the ending diagonal that we were completing at that time. We achieved 1812 on January 22, 2016. You can read more about that post HERE.
The technical analysis I did then and now is based on Hurst Timing Cycles with non-traditional Elliott Wave and other well established methodologies like Fibonacci Sequences, Pattern Recognition and Classical Analysis which adds insight into my trading and investing. I hope this article provides a good example of the application of these technologies.
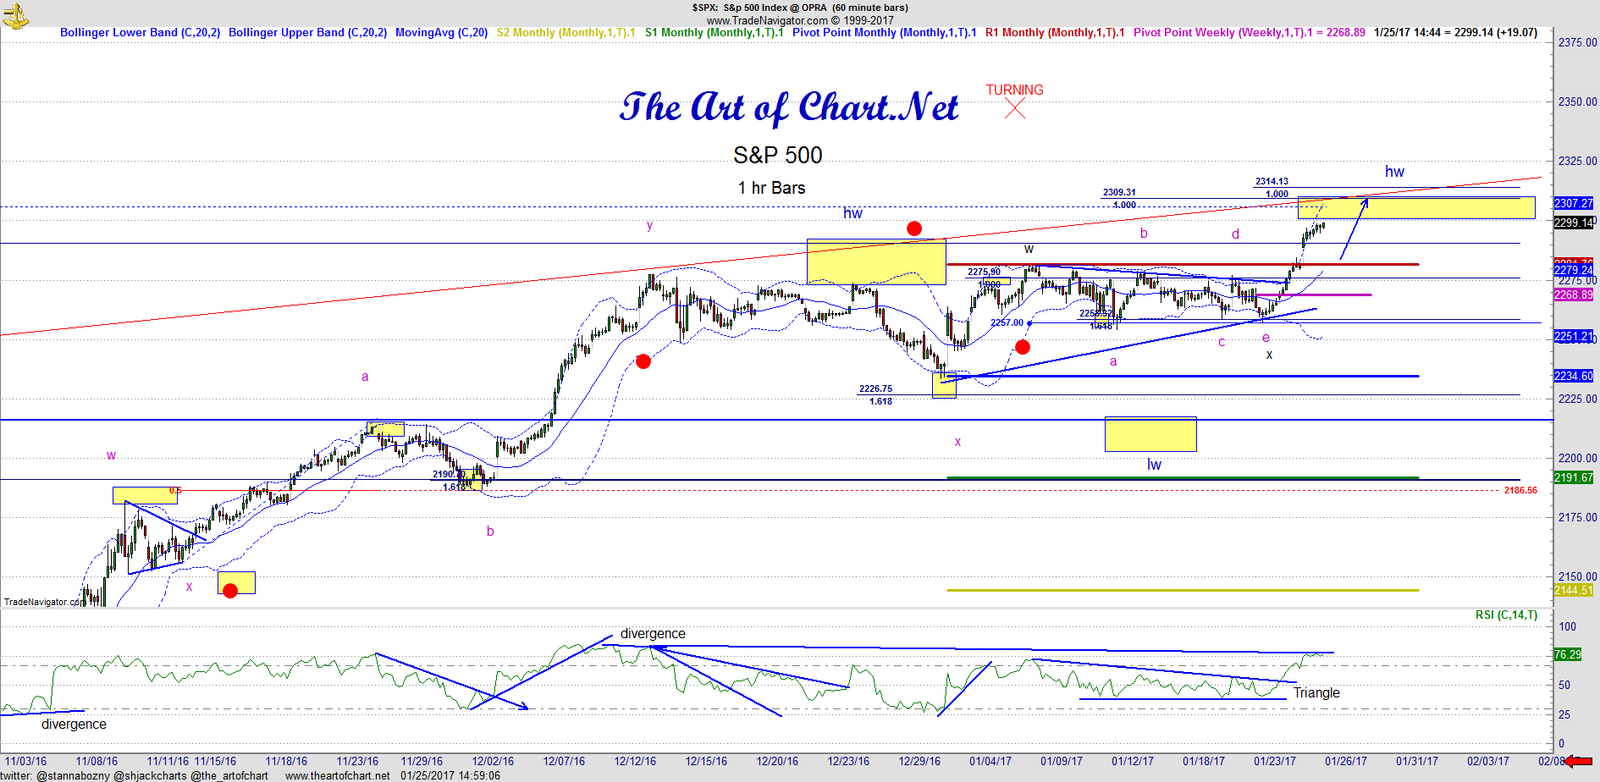
S&P 500 and the Continuation Triangle
On the 1 hour chart, we see a clear continuation triangle and please note the compression on RSI. This is a clear sign that we are about to see a thermal thrust higher. Triangles are very useful in identifying the end of impulses and termination moves. We show a high timing window from our Hurst Cycle work that shows the high is between February 7th and 14th. RSI on the hourly chart but also on the 4 hour and daily all show clear negative divergence. If divergence holds, we are likely in the last legg higher. I am expecting 2300 to 2316 area as the next resistance area. Also note the rising resistance trend line in the same area.
 On the daily chart, note the high window in yellow and the decline we have in mind. Likely we see a 50% retracement around 2057 by July and possibly 2000 or the 61.8% retracement. The structure to the downside will help us fine tune this forecast once we see a turn. The daily chart also shows clear negative divergence on RSI. The rising wedge pattern has a 70% chance of breaking down. This will not happen tomorrow but we expect it to occur in the coming months.
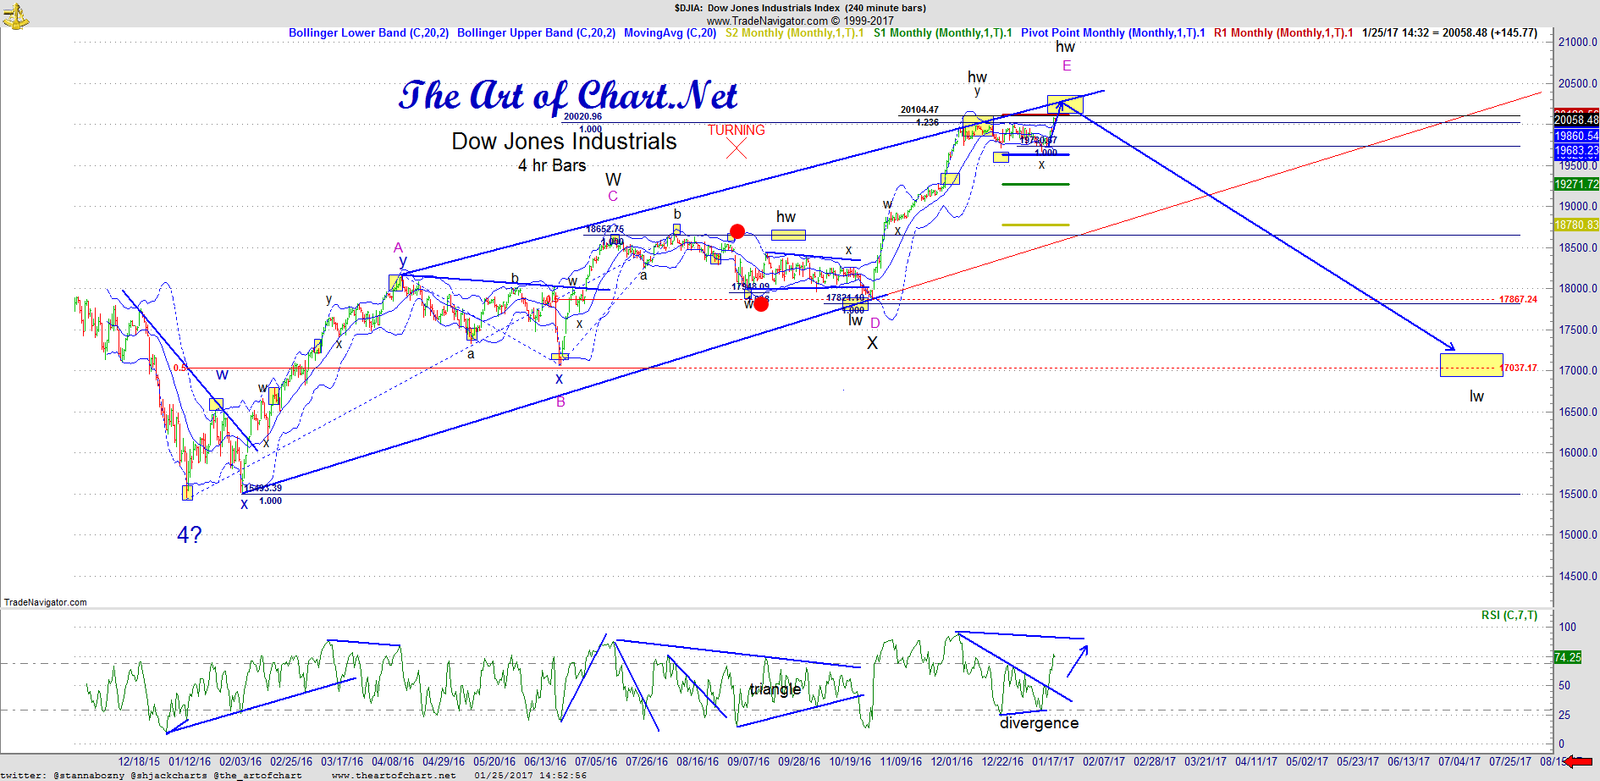
 The Dow Jones Industrials show a similar pattern with a high timing window and a new all-time high with RSI negative divergence. 20200 or so is the resistance area I am looking for in a few weeks. Targets are similar to the downside as we are looking for a 50% pullback to 17,867 and possibly lower to 17037. We will likely see a right shoulder form in February before the decline begins.
 Below please note the 18 month view of the S&P 500 using Hurst Timing Cycles. The yellow cycle is the 18 month cycle and it shows the high window on or around February 7th and the low window in the July 2017 time frame. While these cycles are not precise for day trading, they are extremely useful in forecasting market direction.
 Using Hurst Timing Cycles along with other technical analysis methods like non-traditional Elliott Wave, Fibonacci Sequences, Pattern Recognition and Classical Analysis can add powerful insight to your investing and help keep you on the right side of the market. Try our 30 day free trial to learn more Click Here.
 25th Jan 2017