I had food poisoning for half of last week, so I didn’t manage to get a post out or remind everyone that Stan and I were doing our monthly public Chart Chat on Sunday. If you missed that, the recording is posted here.
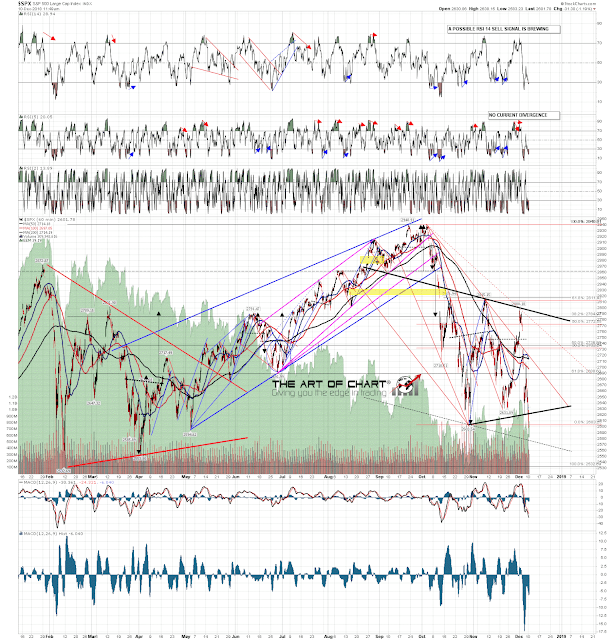
In the webinar yesterday, we were looking at the likely triangle on ES/SPX and what would be likely to happen when that broke down, which it has with the move under 2600 this morning. What generally happens now is an initial break down, then a backtest back into the body of the triangle, likely in progress, and then a thrust down from the triangle, first working target mid to high 2400s though with very significant support at the annual pivot and 2018 low in the 2530-40 area where there is a possible large H&S neckline.
Full Premarket Video from theartofchart.net – Update on ES, NQ, SPX, NDX, RUT, CL, NG, GC, SI, HG, ZB, KC, SB, CC, ZW, ZC, ZS, and DX:
SPX 60min chart:


 10th Dec 2018