Stan and I did our end of year webinar yesterday looking at the outlook next year for equity markets including SPX, NDX, RUT, DAX & NIKK, also AMZN & AAPL, bonds, oil, gold, silver, gdx, us dollar, EURUSD, coffee, sugar, wheat, corn, bitcoin and a couple of other instruments we were asked about that I can’t recall offhand. It is well worth watching and the recording is posted here. Our annual holiday sale on annual memberships also ends on Wednesday 2nd January and if you’re interested, you can find the page for that here.
One of the things we were looking at was whether this current move down has been the first leg down in a bear market likely to extend well into 2019. Our feeling is that is most likely the case, but I was talking about the historical importance of the SPX monthly middle band in showing the nature of a move down. In the absence of something really unexpected SPX will break the monthly middle band, currently at 2651, with a lot of conviction at the close today and the last time that there was then a subsequent close significantly back over the middle band that didn’t then deliver a new all time high before a lower low was in 1957, so that is the level that I’ll be watching next year. If the monthly middle band is strong (monthly closing) resistance then we should see another leg down and we were talking about the targets for that. If SPX can deliver a closing break back over the monthly middle band then the odds will favor new all time highs, likely in 2019.
SPX monthly chart:
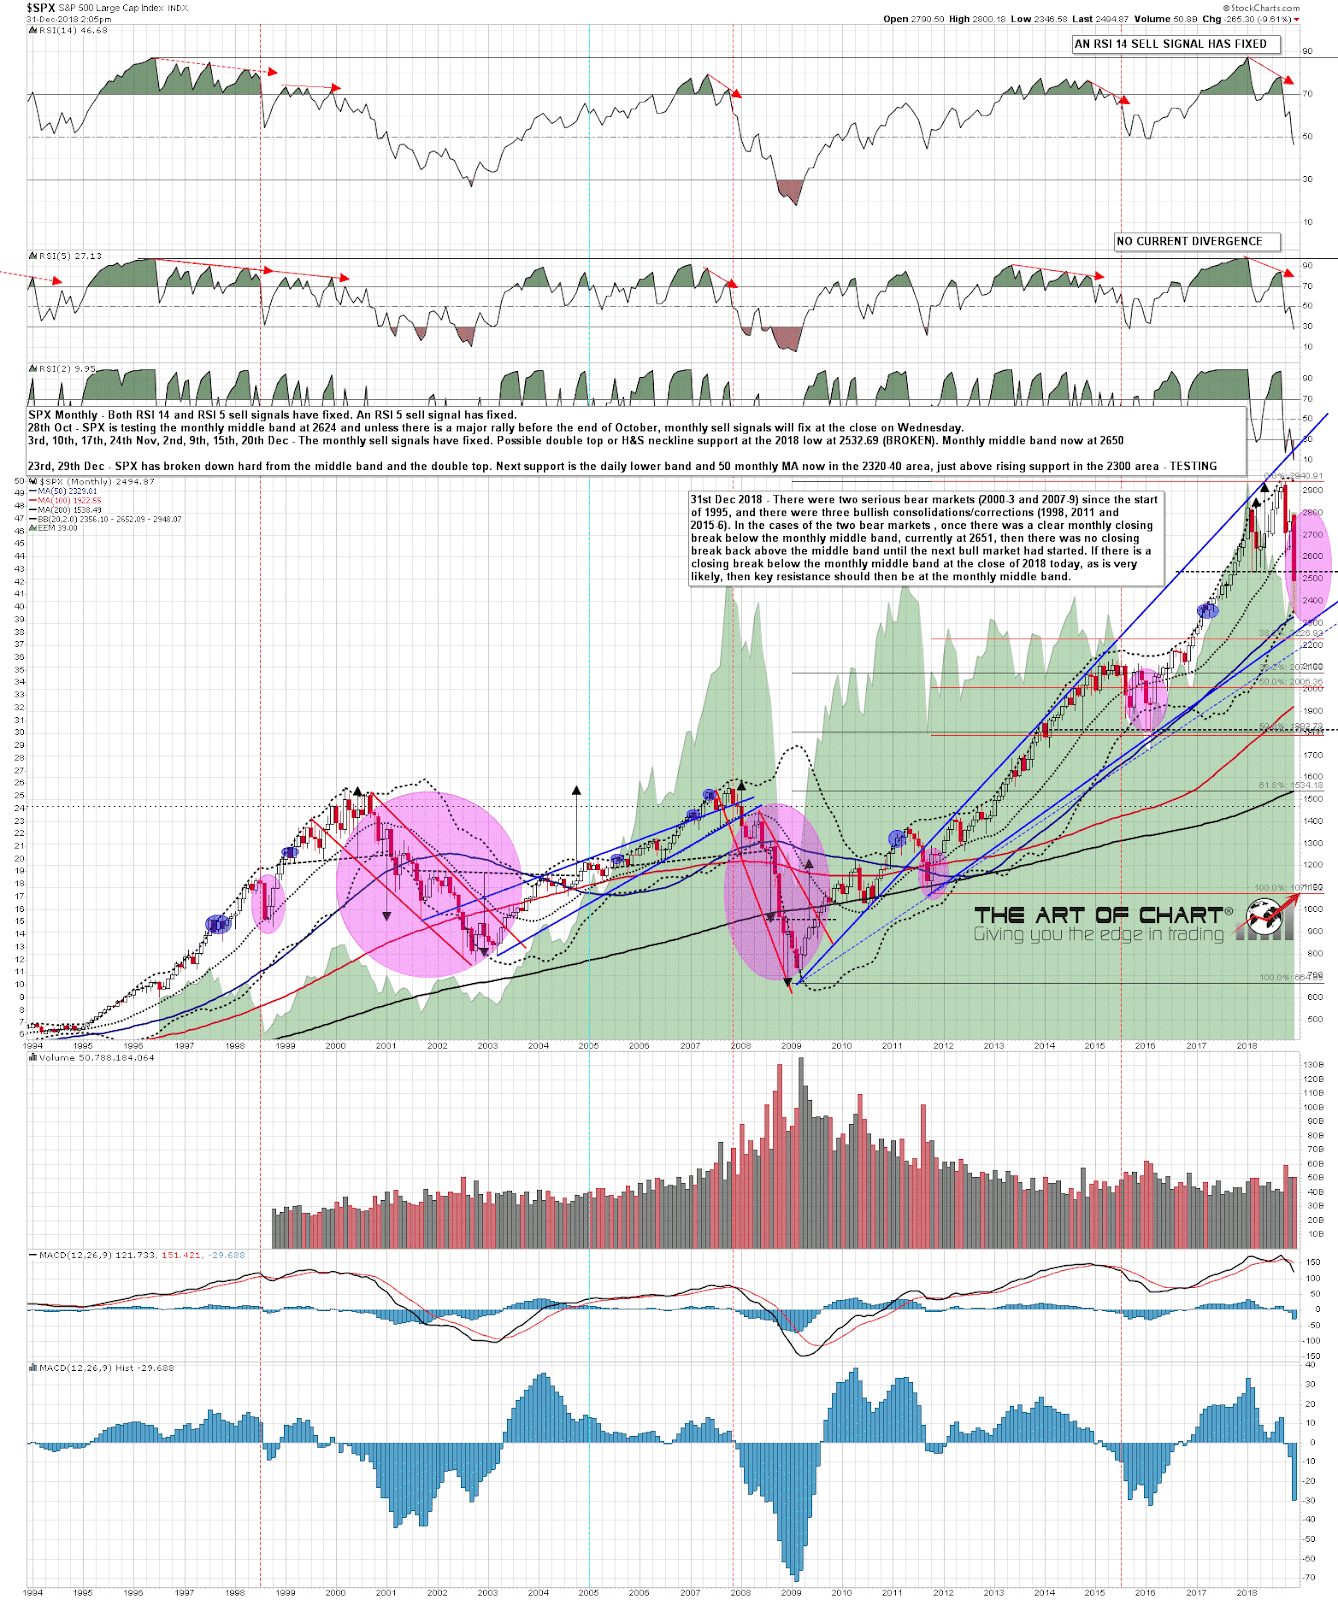
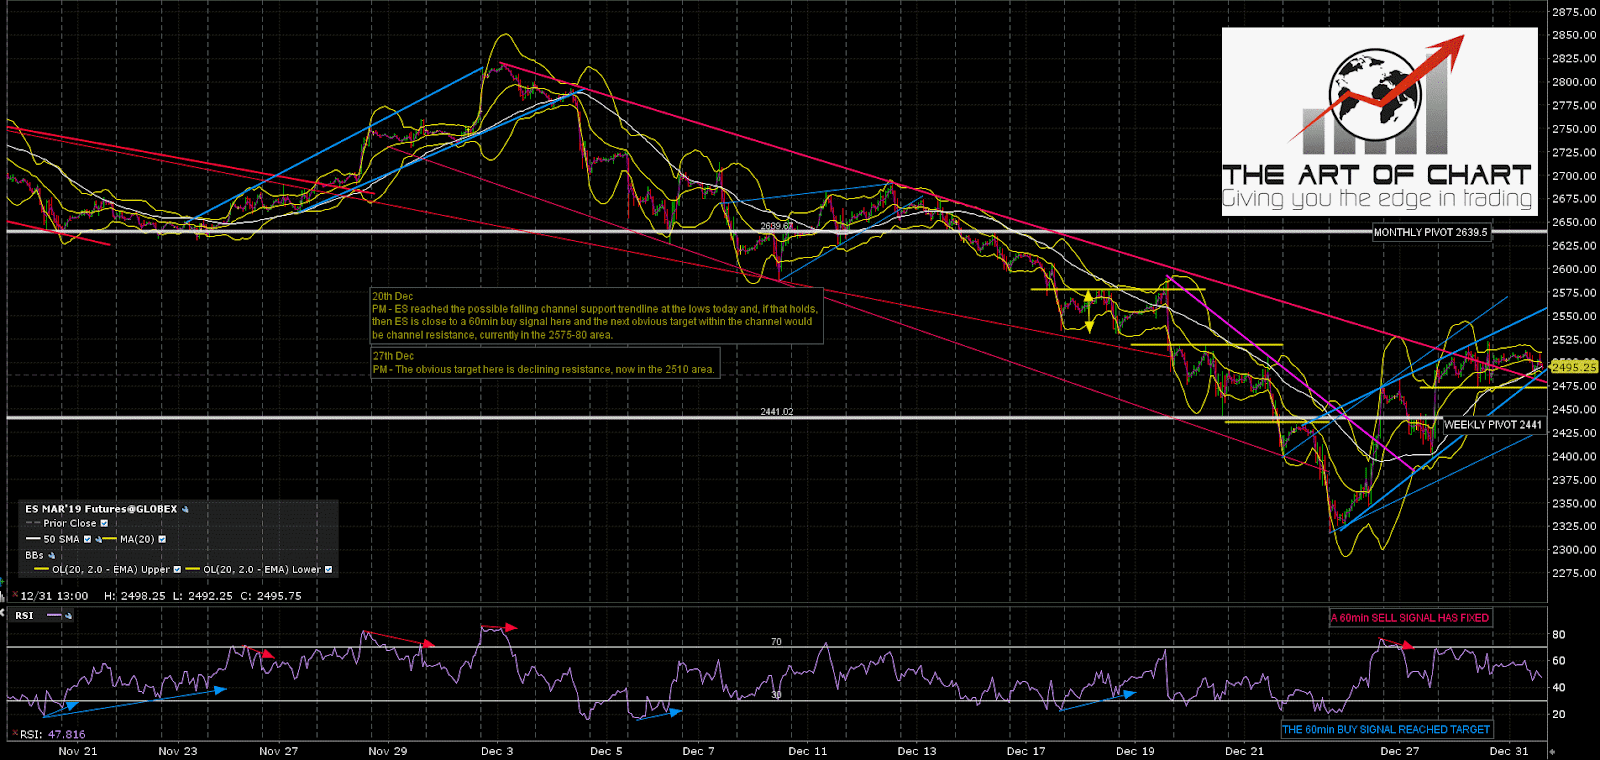
In the short term we are looking at the current move on SPX as a likely bear flag forming before at least a retest of the 2018 low. Ideally the high for this move would be in the 2550-70 area in the next week before a likely lower low with an ideal target at rising support from the 2011 low, currently in the 2300 area. After that we would be looking for a rally that should test the monthly middle band and either (preferred option) fail there into another leg down or break up into new all time highs. SPX 60min chart:

There is a very decent looking rising wedge forming on ES and I’m looking at the resistance trendline of that as key short term resistance on this rally. We could see a break down first to establish a less steep support trendline but if we see any sustained break below the weekly pivot at 2441 then I’d expect the low retest soon afterwards. ES Mar 60min chart:
Everyone have a great holiday tomorrow and a very Happy New Year in 2019 🙂
 31st Dec 2018