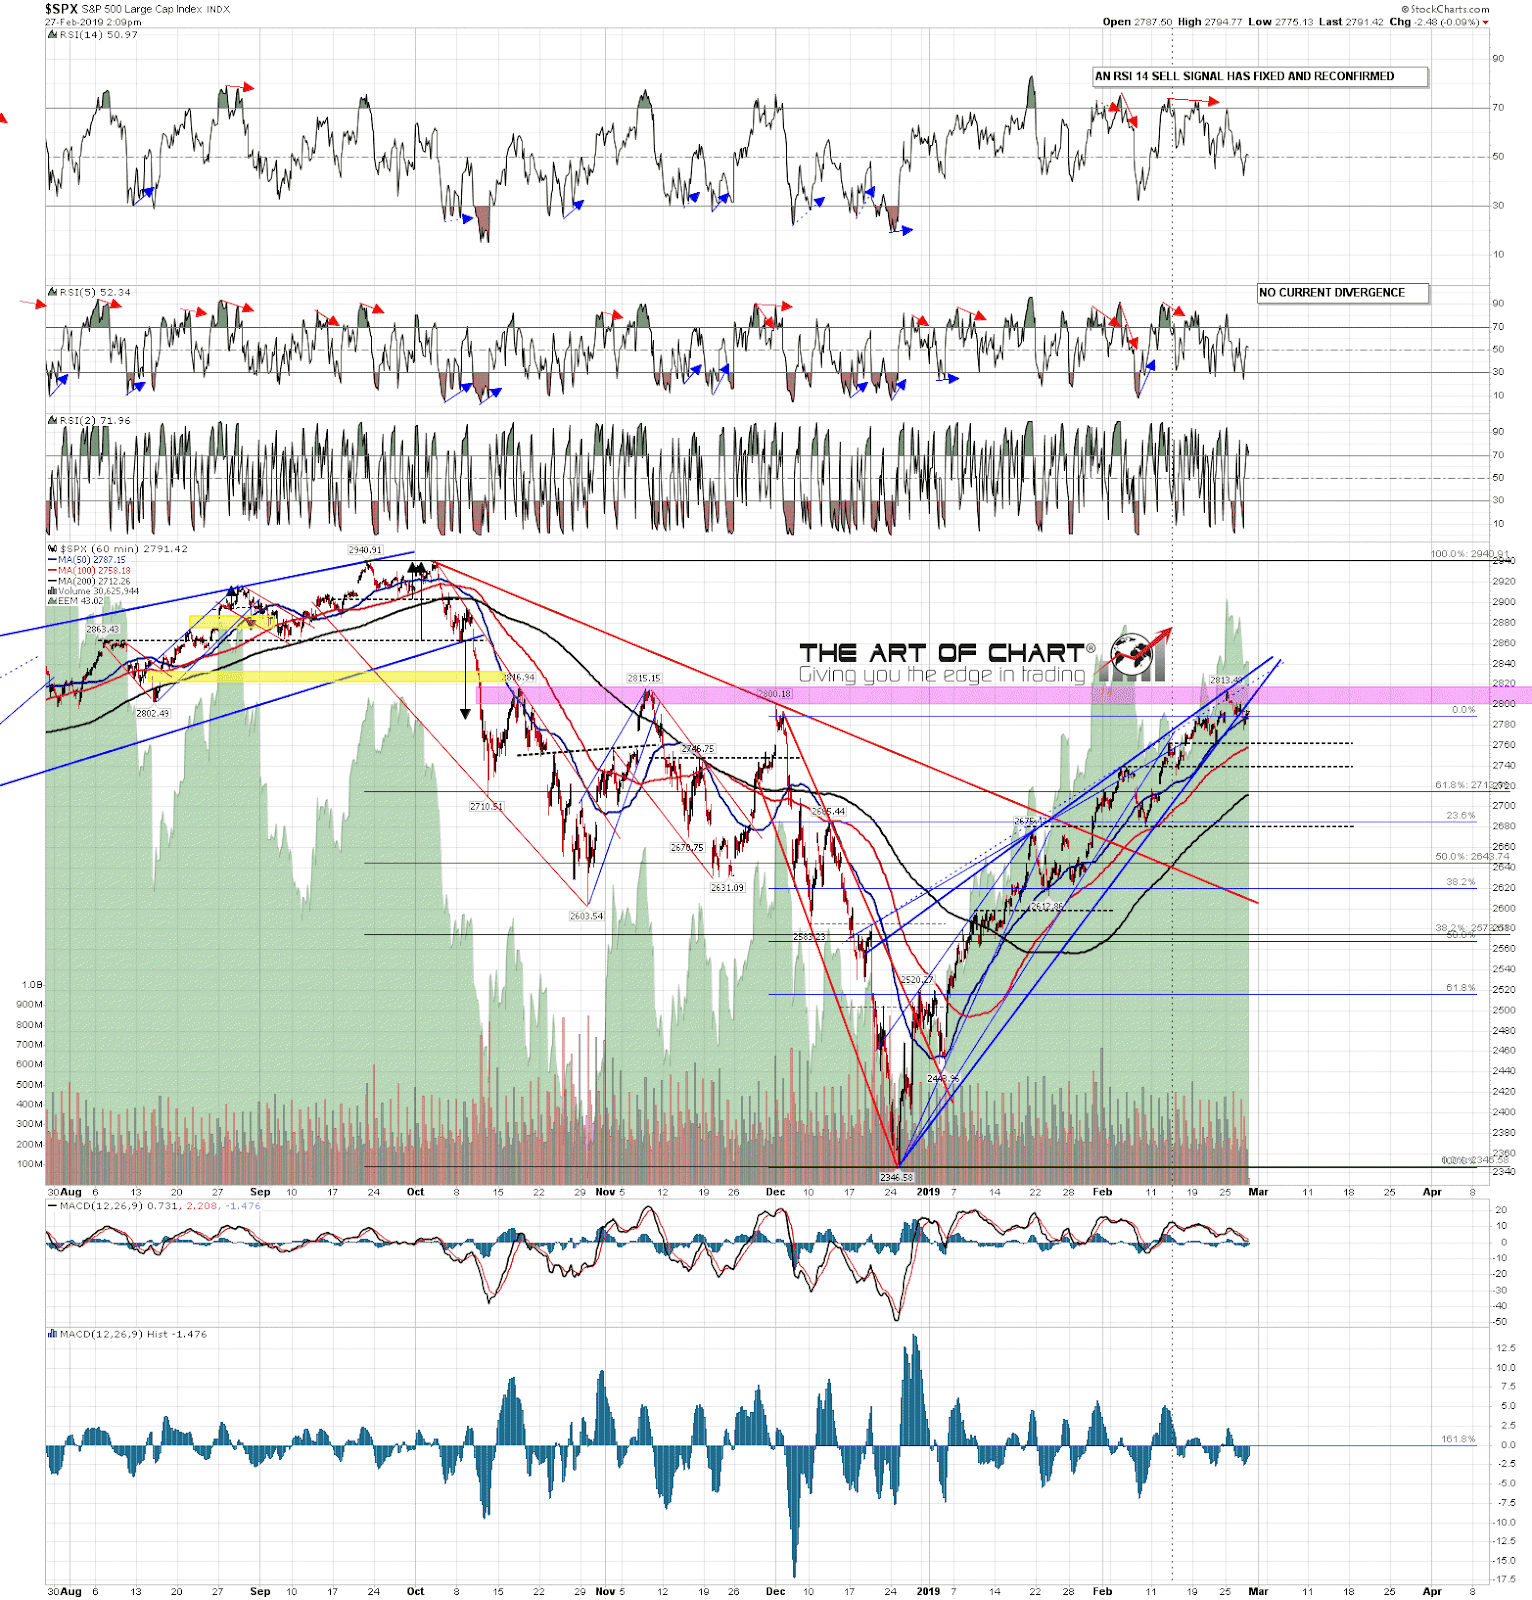
SPX and NDX reached the resistance areas that I was looking at and may be topping out there, the rising wedge support trendlines on SPX, NDX and RUT have all now broken down. So what now?
Well on SPX I have been watching three levels which are all currently in the same area. These are the SPX weekly pivot at 2784, the 50 hour MA now at 2787 and the 5dma now at 2790. What I was looking for this morning was a break down through these, which we saw, then a backtest into those as resistance which failed in that range. That we did not see, and I’m wondering whether we are going to see a high retest next to set up the second high of a small double top. SPX is still on a 60min RSI 14 sell signal with a possible daily RSI 5 sell signal brewing.
SPX 60min chart:
NDX has also found resistance so far in the range of the three rally highs late last year. Again I am wondering about a possible high retest from here. That would set up possible daily RSI 5 negative divergence and another possible small double top.
NDX 60min chart:

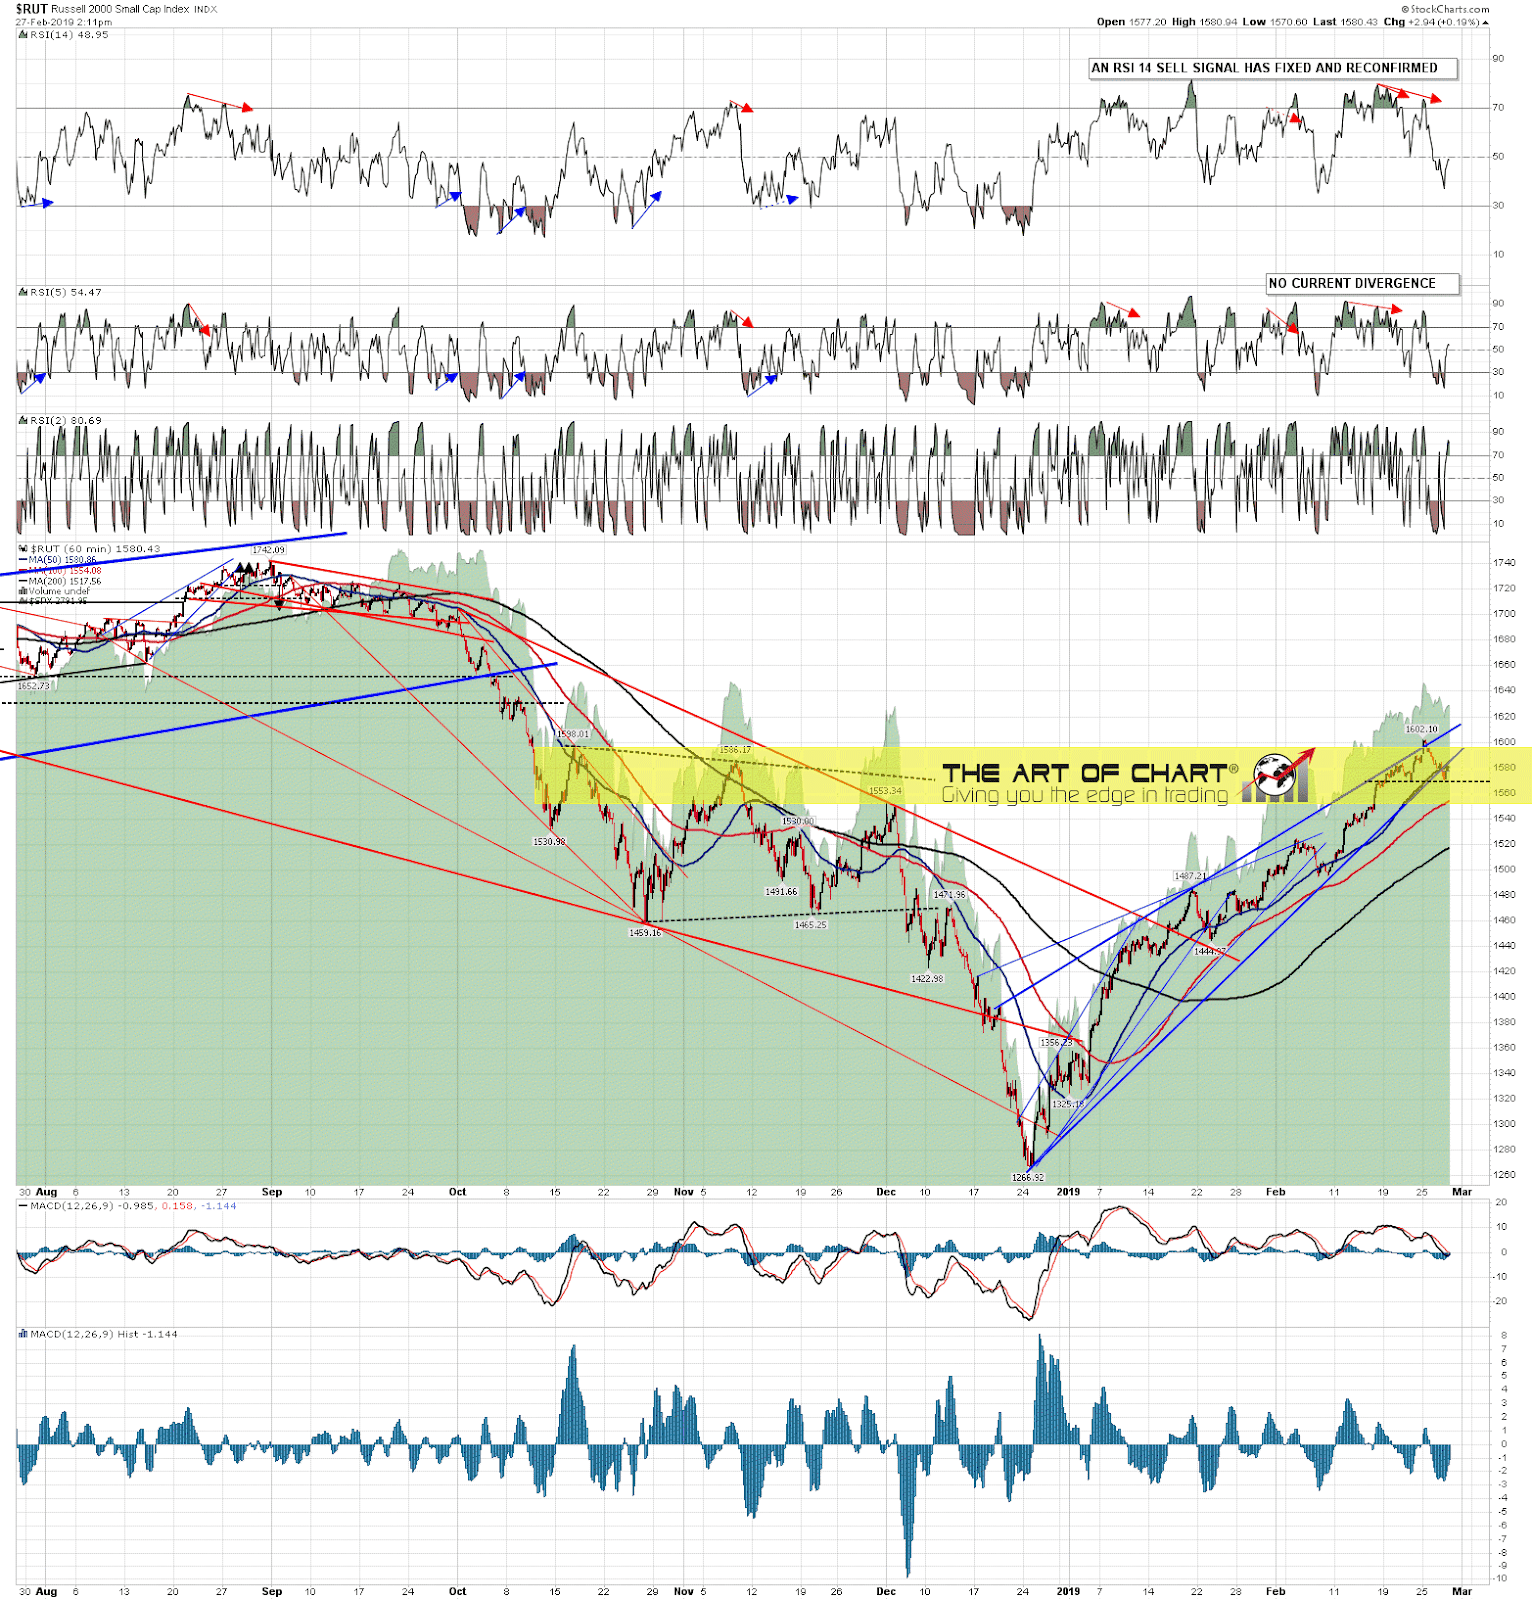
Of the three RUT was the only one to break the weekly pivot (1581) with any enthusiasm, and then reach a possible H&S neckline I’d been looking at in my charts for subscribers. An H&S right shoulder may well be forming there and, if so, that right shoulder would have an ideal right shoulder at the backtest of WP, though the equivalent target on RTY is a bit higher in the 1588 area. We may be forming that right shoulder now, and would likely only see the high retests on ES and NQ if that also breaks up into a rally high retest. RUT is also on an hourly RSI 14 sell signal and in this case weak RSI 14 and RSI 5 sell signals have already fixed, though a high retest could turn those into full signals.
RUT 60min chart:
Overall I’m looking for more retracement here, possibly after rally high retests, but my concern is that the timing cycles have this retracement low middle to end of next week, followed by a push up into the 20th March area. That’s not a lot of time, and the more time is spent topping here then the more modest that retracement is likely to be. The more modest that retracement is, then the higher the chances that the March high will be the possible all time high retest that has been on my radar since SPX broke back over the monthly middle band at the end of January.
Stan and I are doing our monthly free public Chart Chat on Sunday, looking at the usual wide range of equity indices, forex, bonds, metals and commodities. If you’d like to attend you can register for that on our March Free Webinars page. Be there or be unaware! 🙂
 27th Feb 2019