Boy – ‘Do not try to bend the spoon. That’s impossible. Instead …. only try to realize the truth.’
Neo – ‘What truth?’
Boy – ‘There is no spoon’
From The Matrix – 1999.
One thing that has been strange in the last few months is the virtual media silence about the Fed’s increasingly aggressive interventions in the interbank market. This has raised a number of questions. We can assume that there must be some kind of significant issue in the banking system, otherwise the Fed would presumably not be intervening on a scale which seems to be as large or larger than previous periods of official quantitative easing. What that problem is seems unclear, and discussion about it seems to be very muted. That might just be because the financial press are clueless, but it also seems possible that the media are respecting some kind of informal gag order from the Fed, who are also keen that this intervention not be described as QE4. That may be because if this was a QE4 intervention, then they might need to explain clearly the reasons that intervention was needed, and they might be reluctant to explain because it might shake confidence. This is obviously a potential news bomb waiting to happen and is worth bearing in mind until this situation clarifies.
With a free press, which the US rather famously used to have, you’d think that would be a major topic of interest right now, but for some reason it isn’t. This doesn’t seem to be a big issue yet but may become one at some point if interest grows into why the Fed has deemed it necessary to pump hundreds of billions of dollars into banks and bond markets since (Not) QE4 started on 14th October.
All this being said, this (Not) QE4 needs a shorter working name so for the purpose of further discussion I’m going to shorten that to NQE4.
One question that I’ve been asked in the last few days is that with the Fed intervening in markets every day to buy bonds, buying about $9 billion worth so far this week, another $10 billion between Thursday and Friday last week, whether it’s possible to get any significant decline on equities going. SPX is up slightly under 10% since NQE4 started on 14th October and NQE4 shows no signs of stopping anytime soon, so soon enough this intervention may need to be counted in trillions. Whatever the name used that is a very serious intervention, and judging by the effect of similar looking interventions in QE1 through QE3, are likely to put an overall bid under equity markets while depressing bond prices, and we have been watching bond prices decline over this period as well. The trajectory of this intervention on the Fed balance sheet looks roughly equivalent to QE3 so far, though it is averaging over $100 billion per month so far, with QE3 having averaged slightly about $92 billion per month through 2013.
Why do bond prices decline while the Fed is buying bonds on a large scale? I have a couple of theories but no real knowledge. What I can say is that bond prices have tended to decline during QE periods and rise as they end and for a while after they end. That is what actually happens, why is another matter. I wrote a post about this called ‘The Great Brain Robbery‘ in May 2014 part way through the huge rally in bonds after the end of QE3 That’s worth a look if you are interested or just want to read something amusing about the idiotic things that analysts can do when they act as a flock of clueless sheep rather than trained humans with higher than average intelligence.
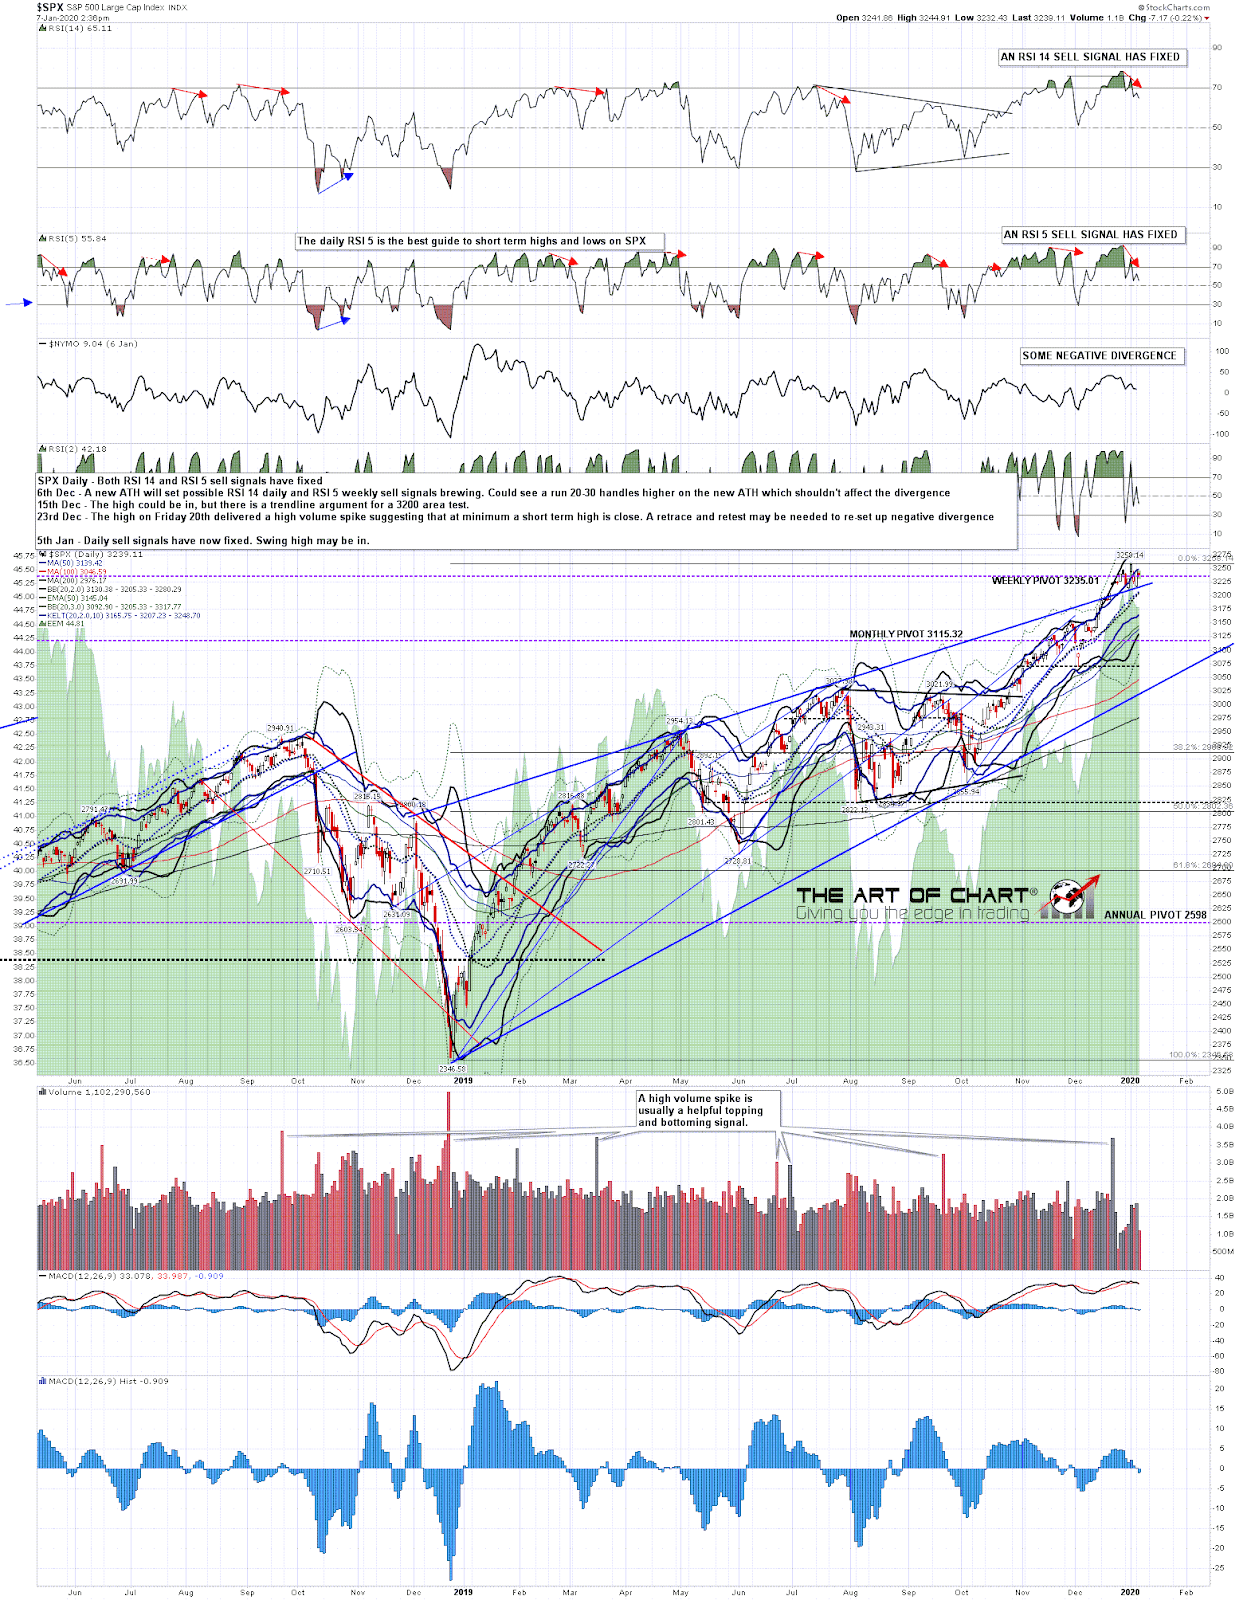
In terms of the short term though SPX now has a fixed RSI 5 daily sell signal and there were five of these in 2019 , a memorably bullish year, and these all reached target. I’ve pulled an SPX daily chart from my first post of 2014, just after 2013, another very memorably bullish year with QE3 running through it from start to finish, and you can see here that there were five of these signals in 2013, and they all reached target.
The volume spike that I noted in December is also a significant topping or bottoming indicator. Of the last three volume spikes as large on SPX as that spike in December, the first was the high in October 2018, delivering a 20% decline into December 2018. The next was the spike at that low in December 2018, delivering a bull move of 38% so far, and the third was at an interim high in March 2019, that delivered a 3% decline from high to low. If you look at the 2013 chart you’ll see that these volume spikes were also good at picking interim highs and lows then.
In the short term therefore I don’t have any real concern about NQE4, as previous QE periods didn’t stop similar setups from delivering then. It is a reasonable expectation that at minimum that this signal reaches target and that SPX should drop at least 100 handles or so from this high to the next low.
My concern, if the Fed continues to pour in tens of billions of dollars per week into markets, is that it will be hard to sustain any larger downtrend while that continues. 2013 saw a rise on SPX of 27% or so on QE3, after a 12% rise in 2012. Last year’s rise was over 30% but NQE4 may mute any retracement of that move that we see this year. I’m definitely keeping that in mind. A healthy paranoia on the bear side seems advisable. On to the markets. 🙂
On the SPX daily chart both RSI 14 and RSI 5 sell signals have fixed and a topping setting is forming here that may take SPX down 100 handles or so into the 3160-70 area. As I’ve been explaining above, that target looks very credible. It may be that will be all we see for the time being though. We’ll see.
SPX daily chart:
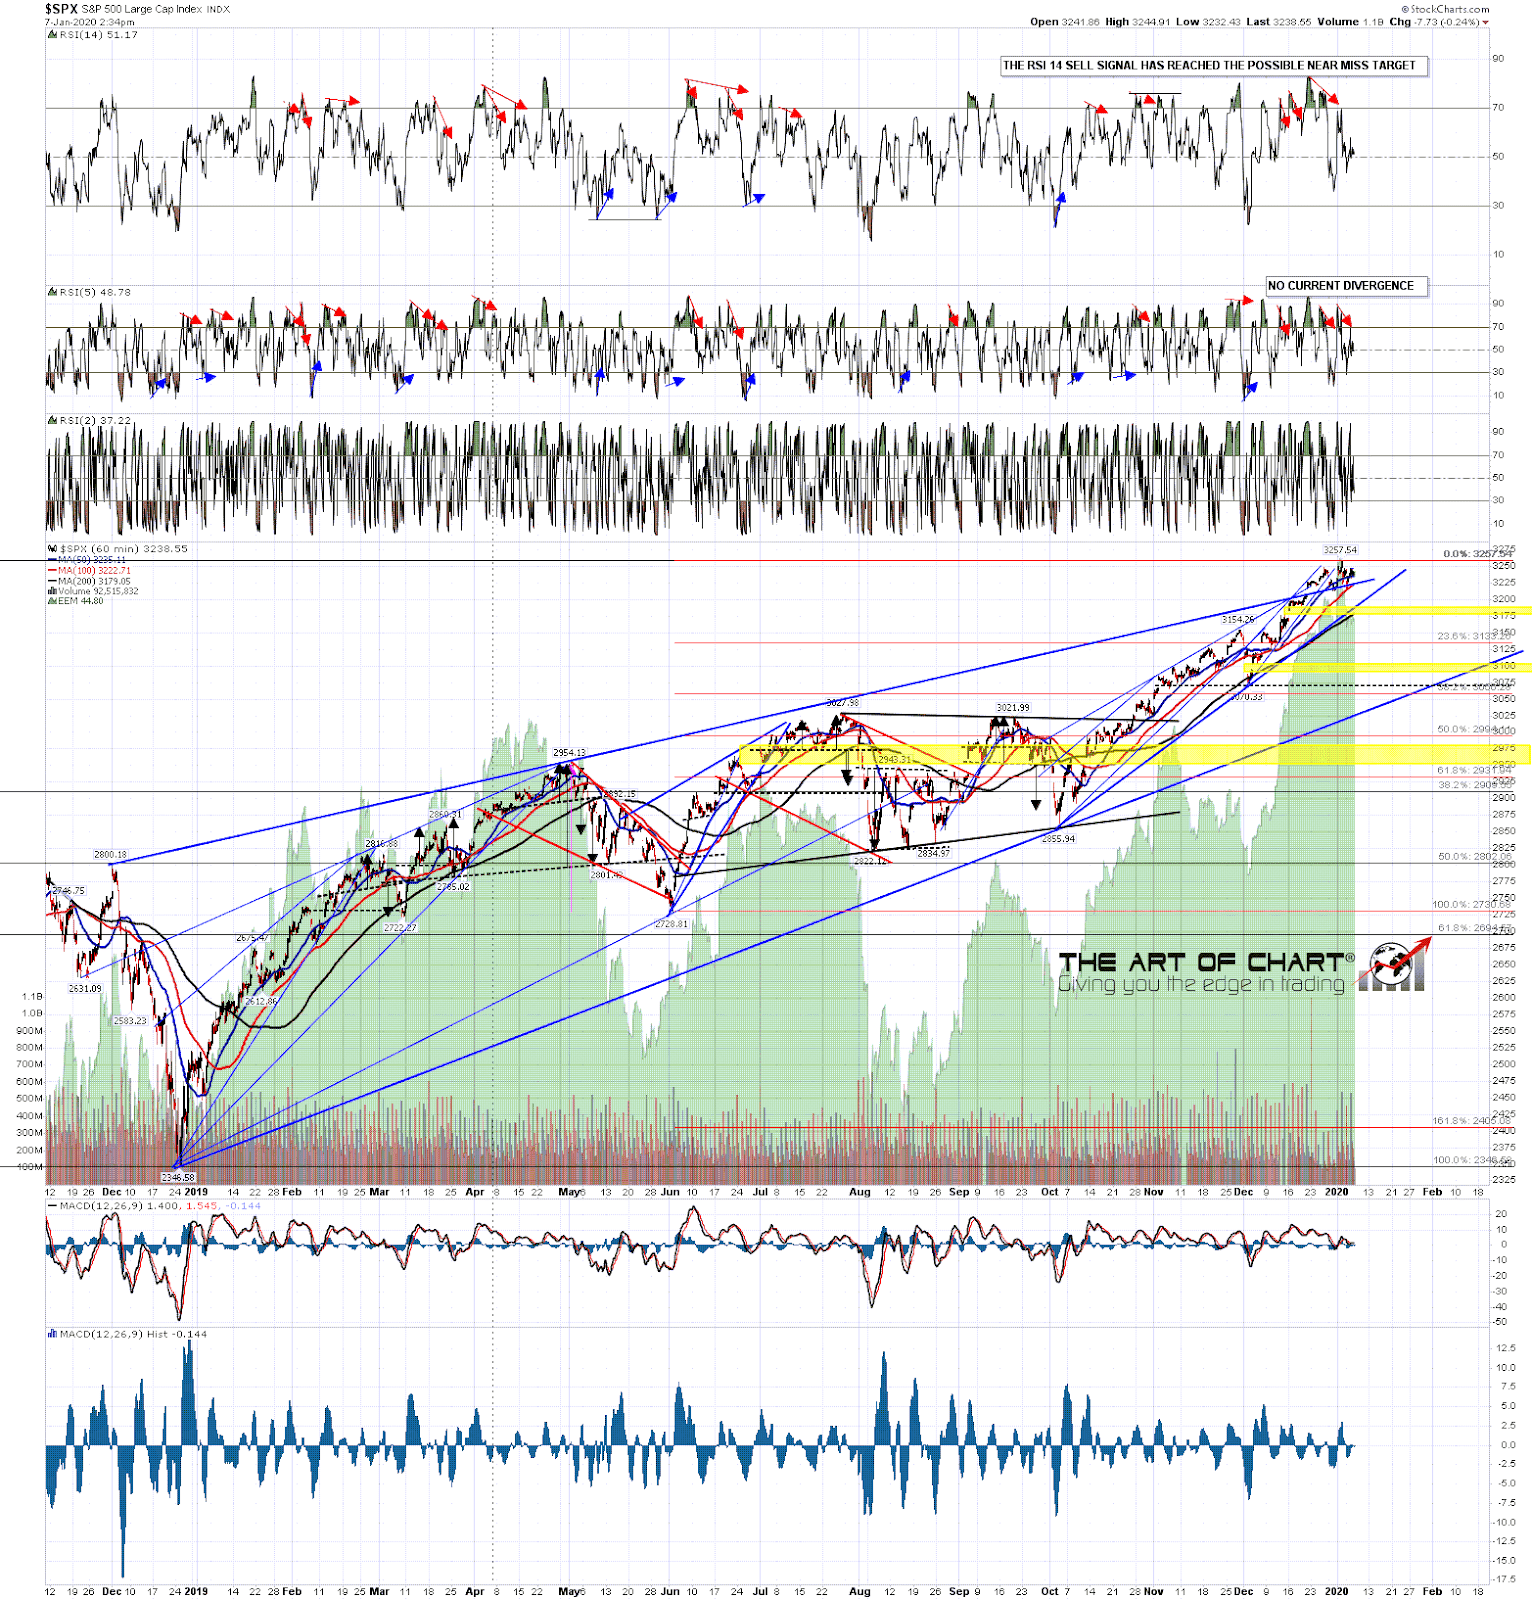
On the hourly chart the 60min RSI 14 sell signal hasn’t reached target yet and SPX has tested for the third time in three trading days the important short term trend support at the 50 hour MA, currently at 3235. On each of those days the close has been back over the MA. When that changes then the downside opens up.
SPX 60min chart:
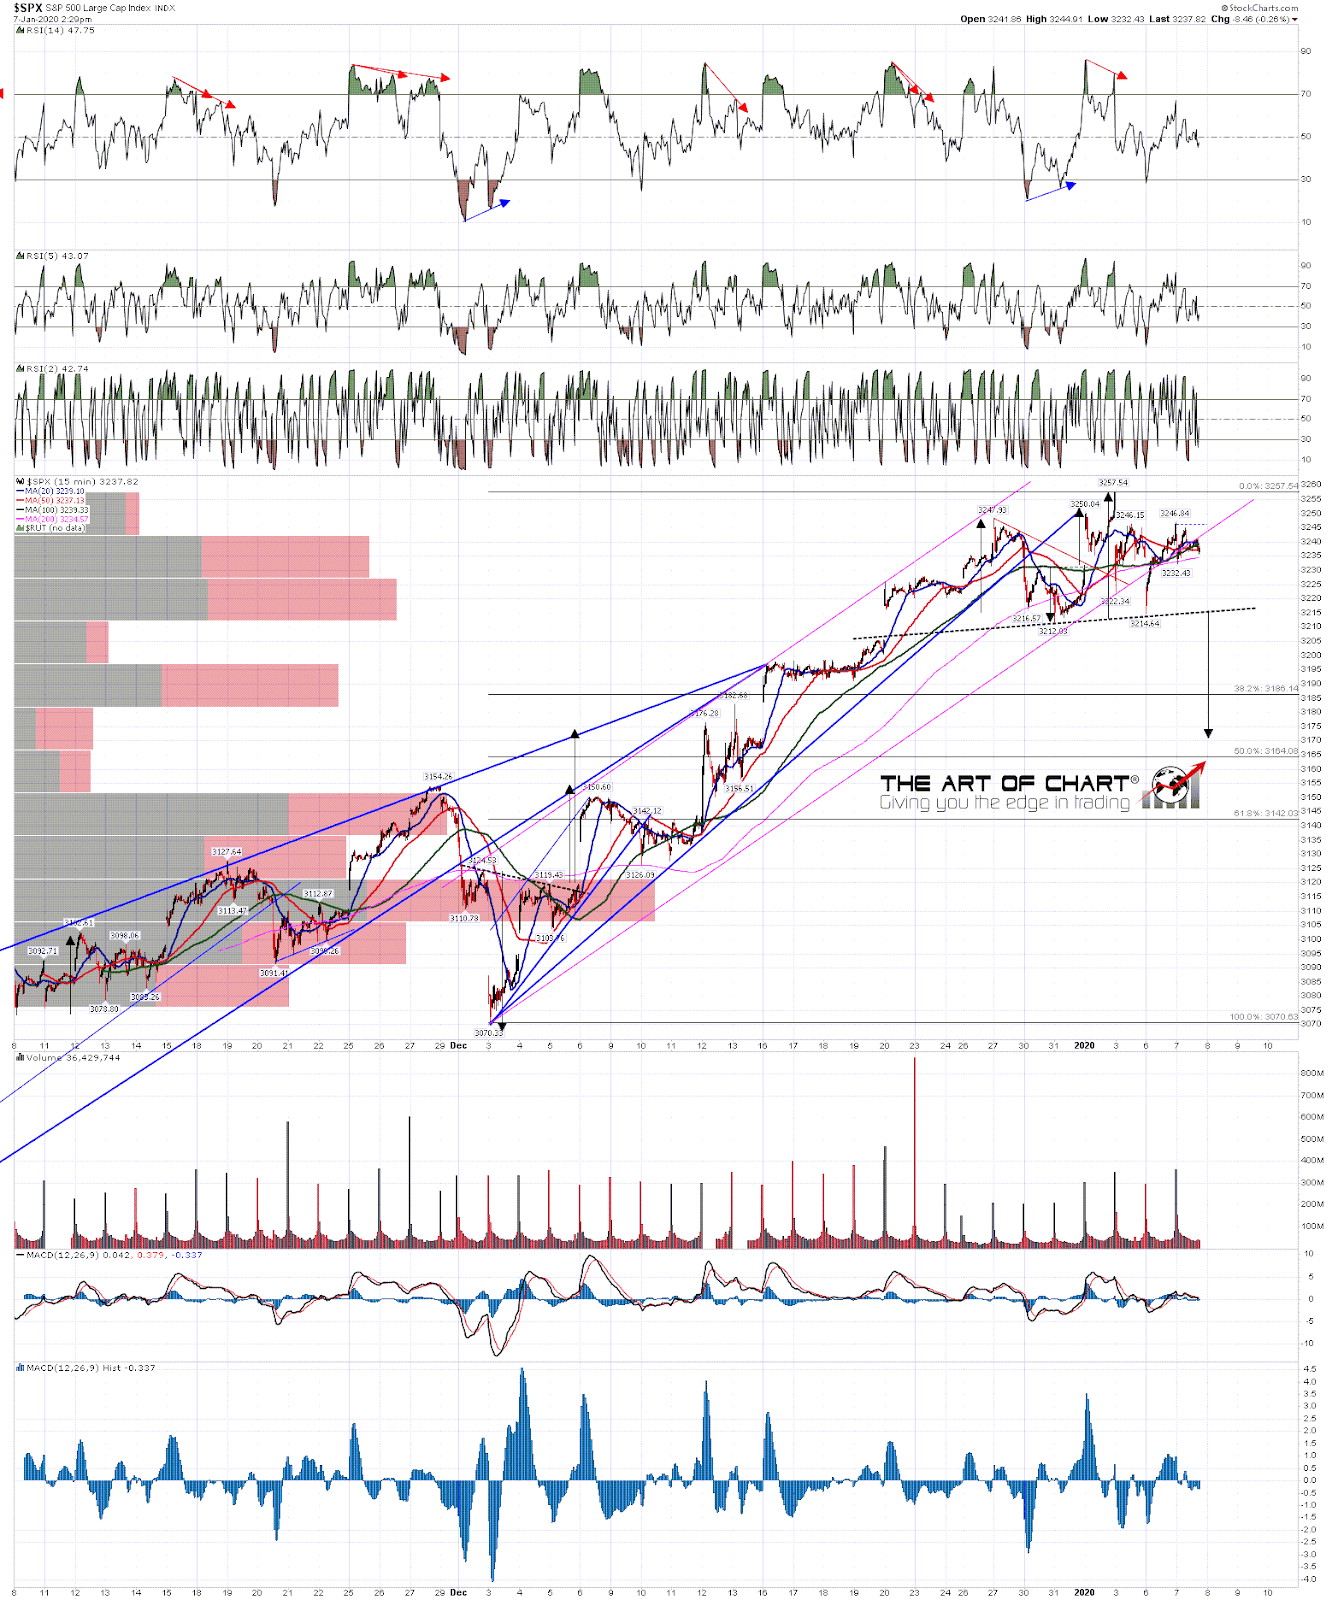
In terms of the pattern setup and H&S may well be forming here and on a sustained break below 3215 the H&S target would be in the 3170 area. The H&S is a bit messy and if the 50 hour MA continues to hold as support SPX could still retest the highs. If seen however that should be the second high of a double top and I’d expect any new all time high to be marginal and short lived.
SPX 15min chart:
I was planning to have a look at the January Barometer stat today, but felt it was more topical to look at declines during QE periods instead. I’ll be covering the January Barometer next time and (spoiler alert), that stat looks a lot more impressive than the extrapolation from the first five trading days of January that I was assessing in my last post. I’ll likely write about that at the weekend.
For this week I should mention that Stan and I are doing two free public webinars. The first, an hour after the close tomorrow (Wednesday) is looking at trading commodities this year using current examples and setups, and the second, an hour after the close on Thursday, is our monthly free webinar looking at FAANG stocks and key sector ETFs. If you are interested in attending either or both you can register for those on our January Free Webinars page.
 07th Jan 2020