For me, although there are always of course bigger picture scenarios developing as well, the best way to view the market in the near term is to see it as a series of inflection points which generally have a more likely looking option for the next move, but can always break either way. My next to last post on Wednesday 29th April was at one such inflection point, within an uptrend move that was exhausted at the high that day, and delivered a solid retracement back to main support at the daily middle band, which then held and from there SPX has rallied almost back to the April rally high.
Is there anything about this sequence which is inherently bearish? No. Since the rally from the crash lows started in March there have been two significant retracements, one in April and this one that bottomed at the start of May, and both of those bottomed at the daily middle band, which is the obvious backtest target for a significant backtest within an ongoing bullish trend. If we are to see a serious reversal, that daily middle band would need to be broken and converted to resistance, and until that happens this could be another leg up that has started towards a considerably higher high, though I’m doubtful about that happening.
SPX daily chart:
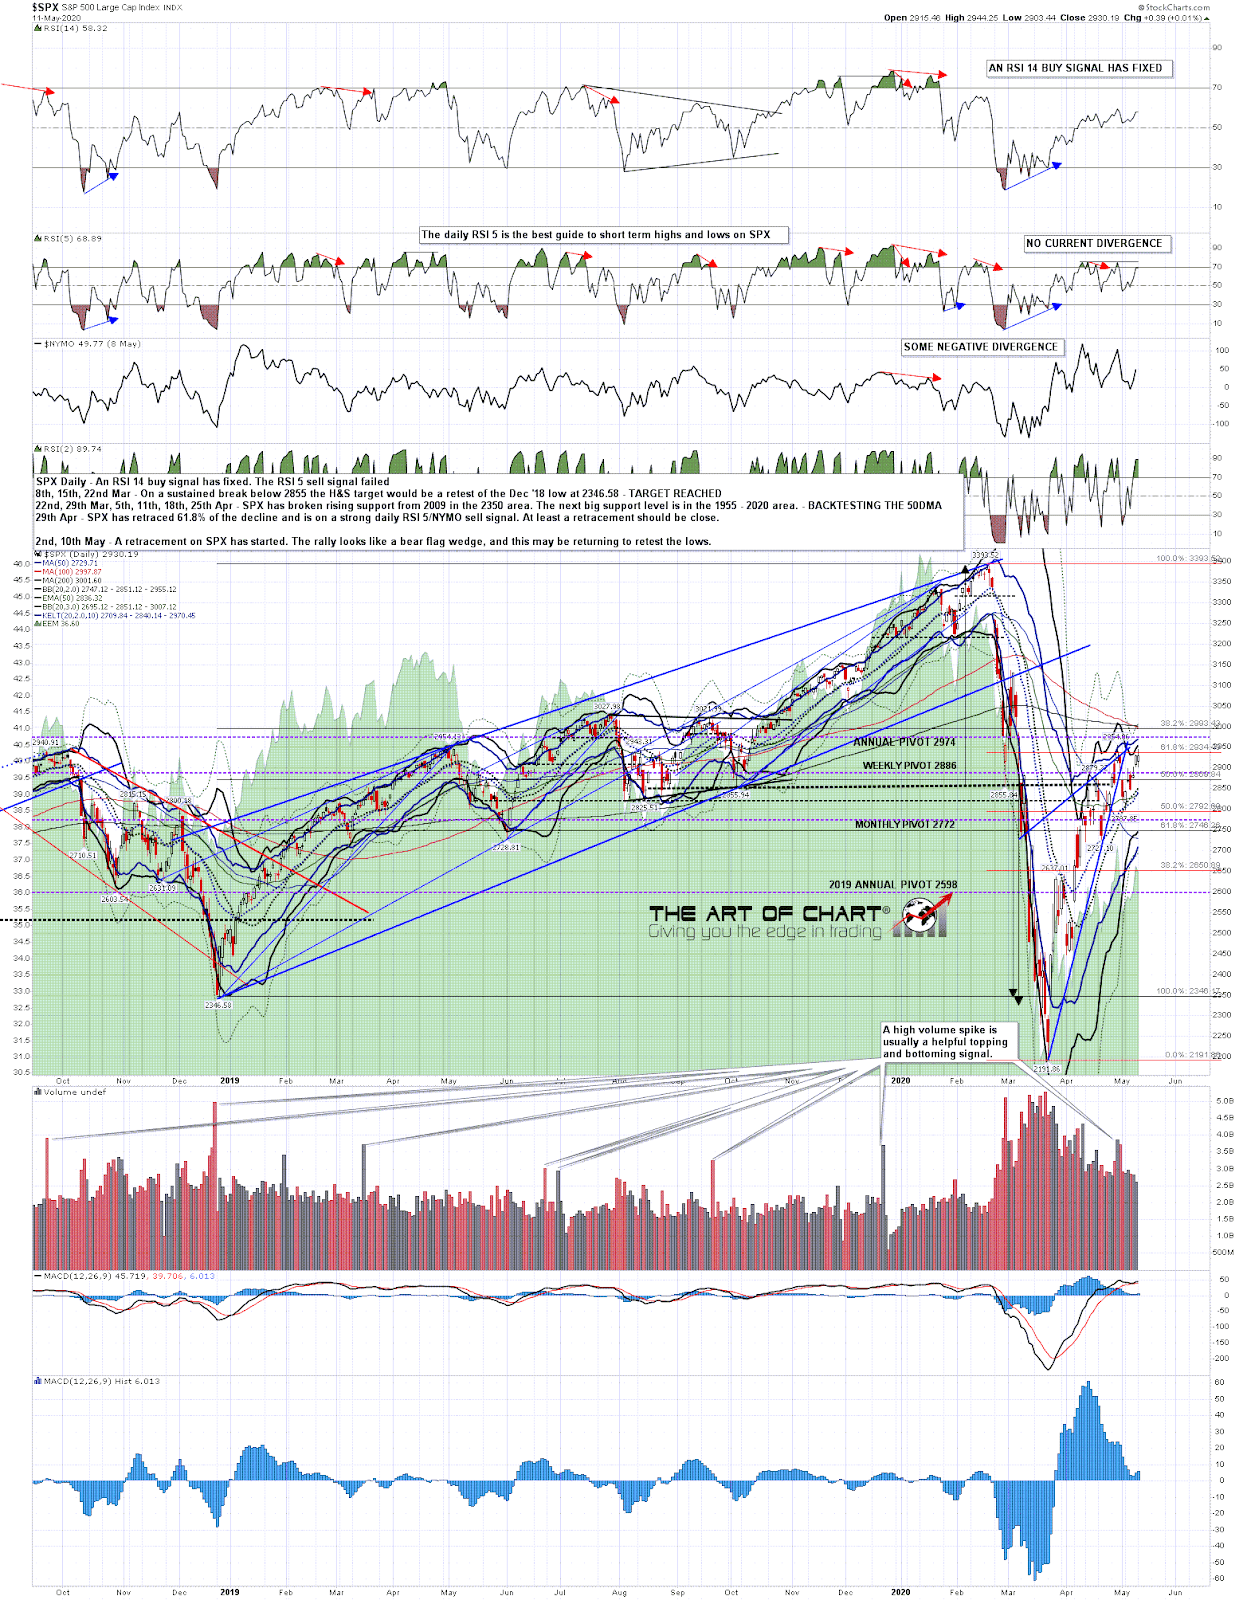
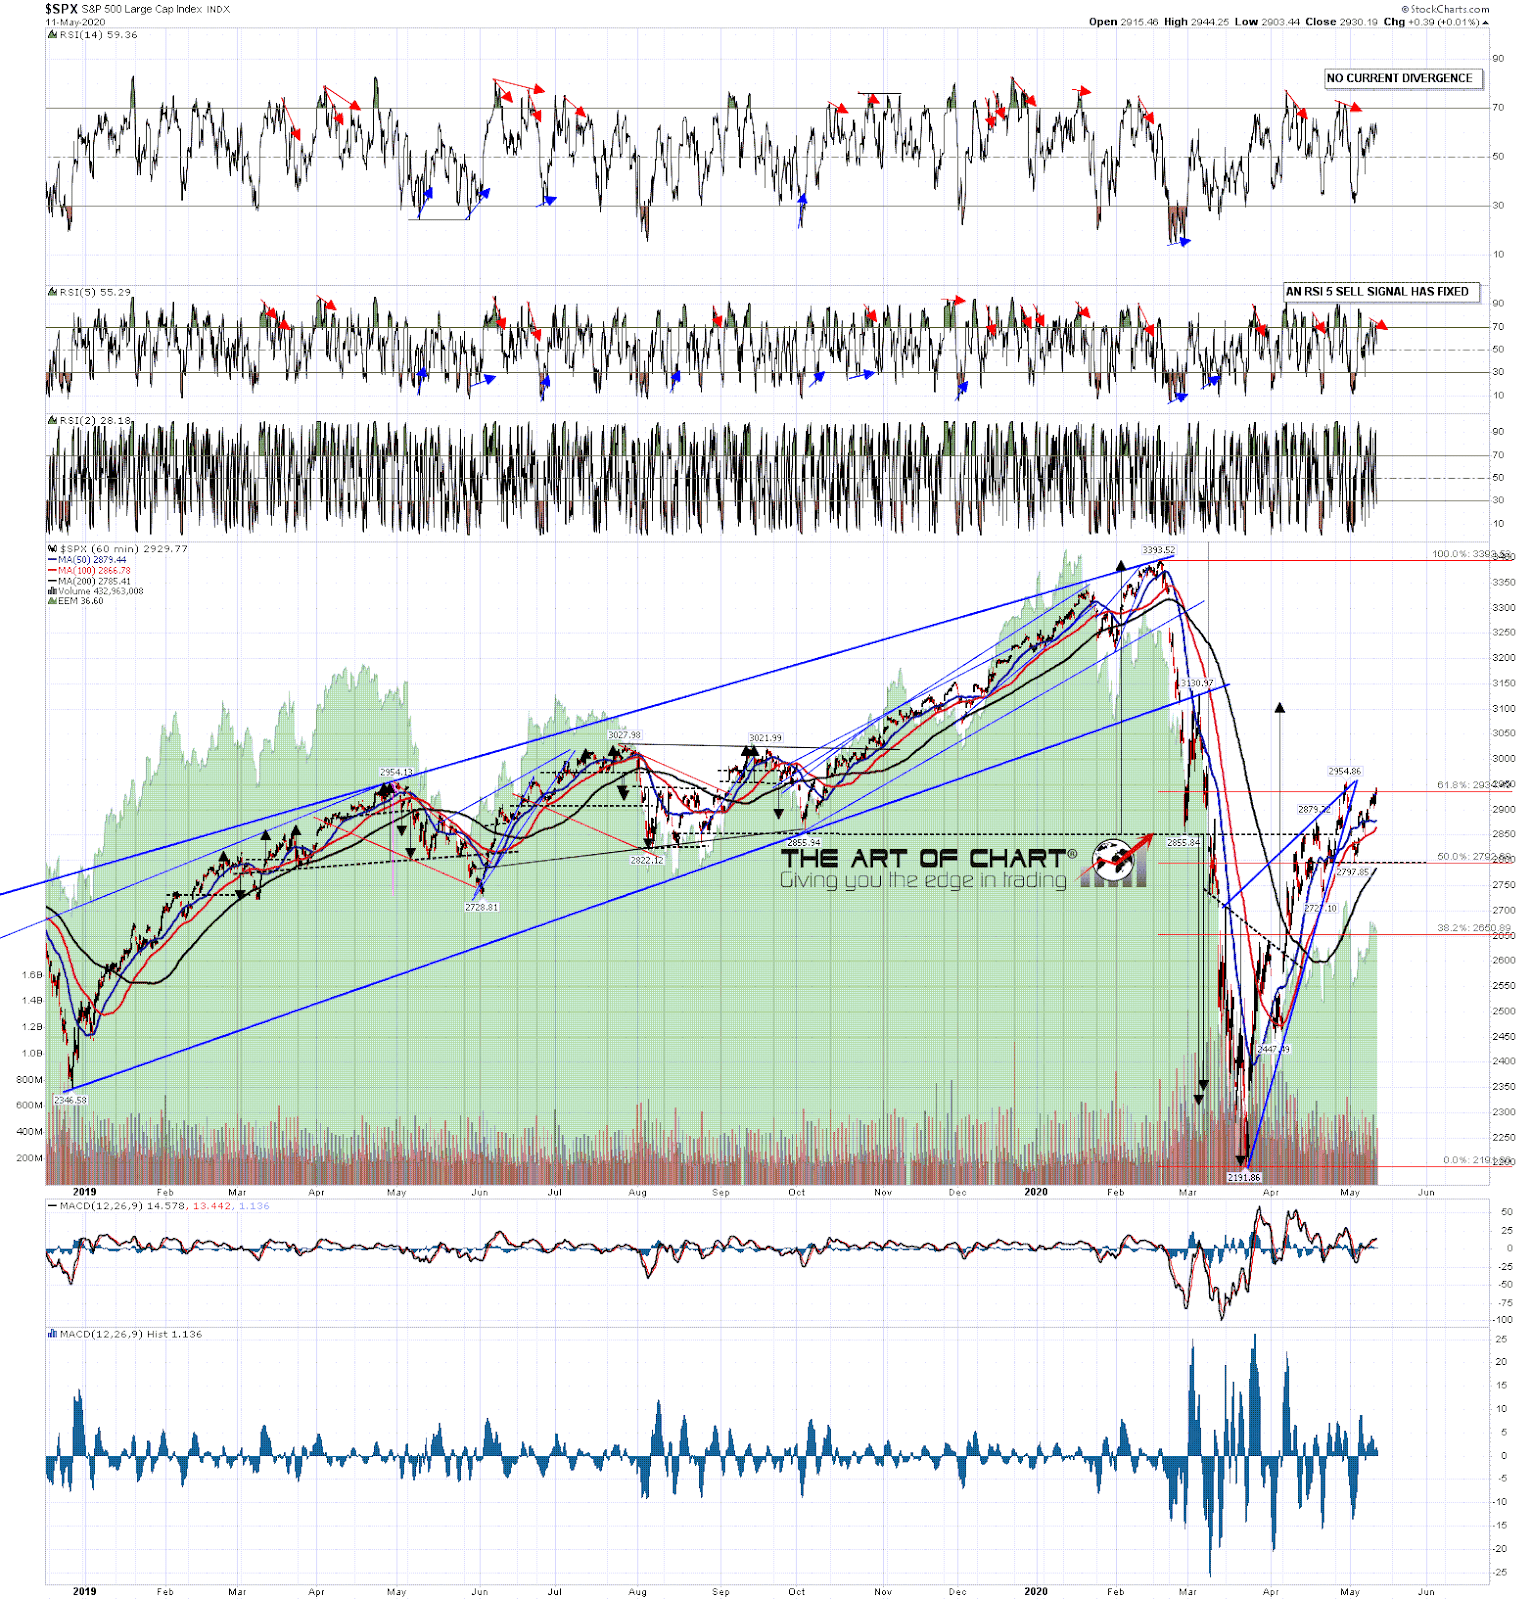
If another leg up has started then SPX will go through the retest of the rally high at 2954 and break back over 3000. If seen I would have clear upside targets. The first of those would be on SPX and that would be the IHS target in the 3115 area from the downsloping IHS that formed at the March lows and I’ve had marked on my hourly and 15min charts since that broke up:
SPX 60min chart:
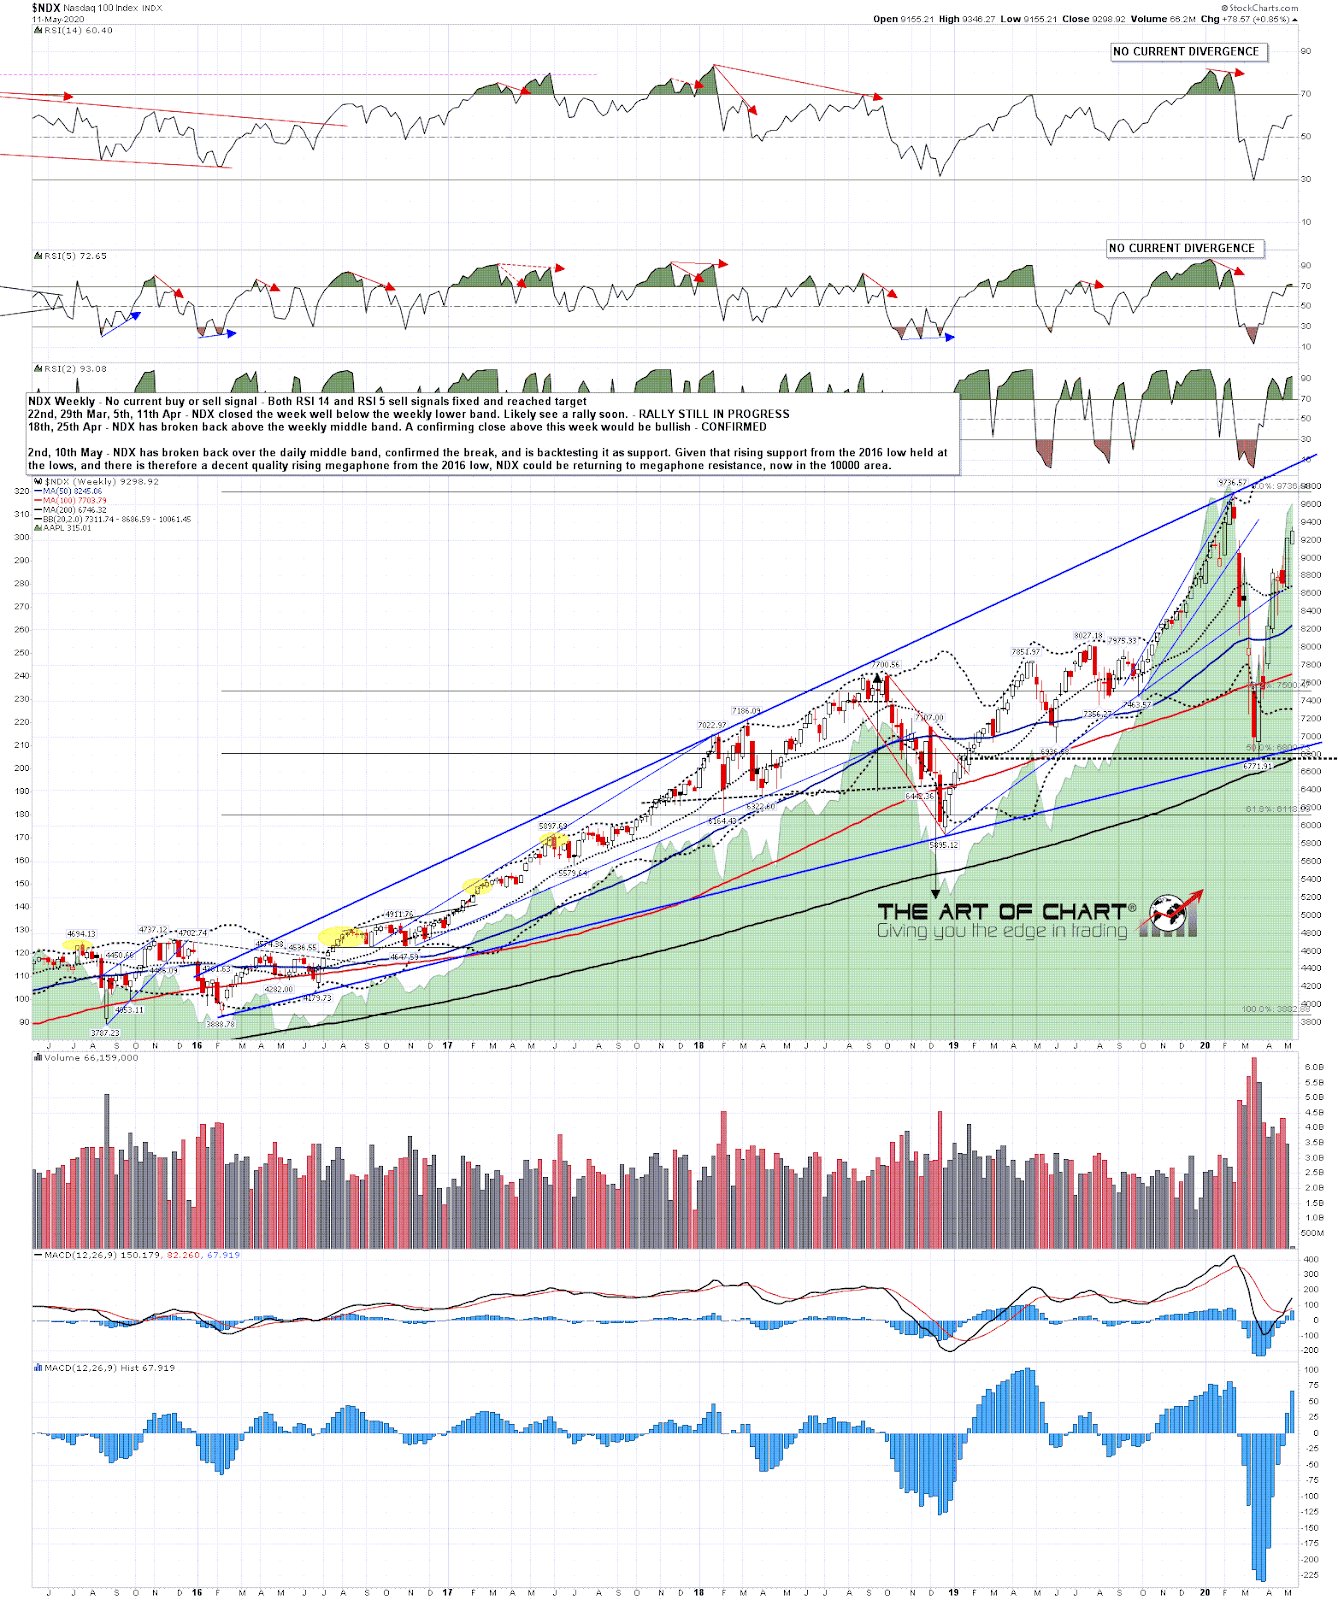
NDX was of course the only index that didn’t break trendline support into the March low. That held the support trendline on a strong looking rising megaphone from the 2016 low. If that holds and SPX goes higher I’d be looking at that for either a retest of the NDX all time high or a hit of megaphone resistance, slightly north of 10,000. Likely there would be significant resistance at one or the other of course.
NDX weekly chart:
More likely than that at the moment though is that the rally from the March low is still topping out. If so then the next obvious target would be a retest of the April high at 2954.86. Ideally there would be a marginal higher high, setting up a decent quality double top, then on a sustained break back below the last low at 2795.85 the double top target would be in the 2635 area.
There is another option though, as SPX looks as though it might be making a lower high here. If so then there is another option, as to the still possible double top option would be added the possibility that a bull flag or triangle might be forming here. If so SPX could reverse here at that lower high, into a next low under 2795 (bull flag) or over 2795 (bullish triangle). After the flag or triangle had formed it would likely break up into at minimum a retest of the April high and potentially higher into the more bullish scenario targets that I was looking at earlier.
SPX 15min chart:
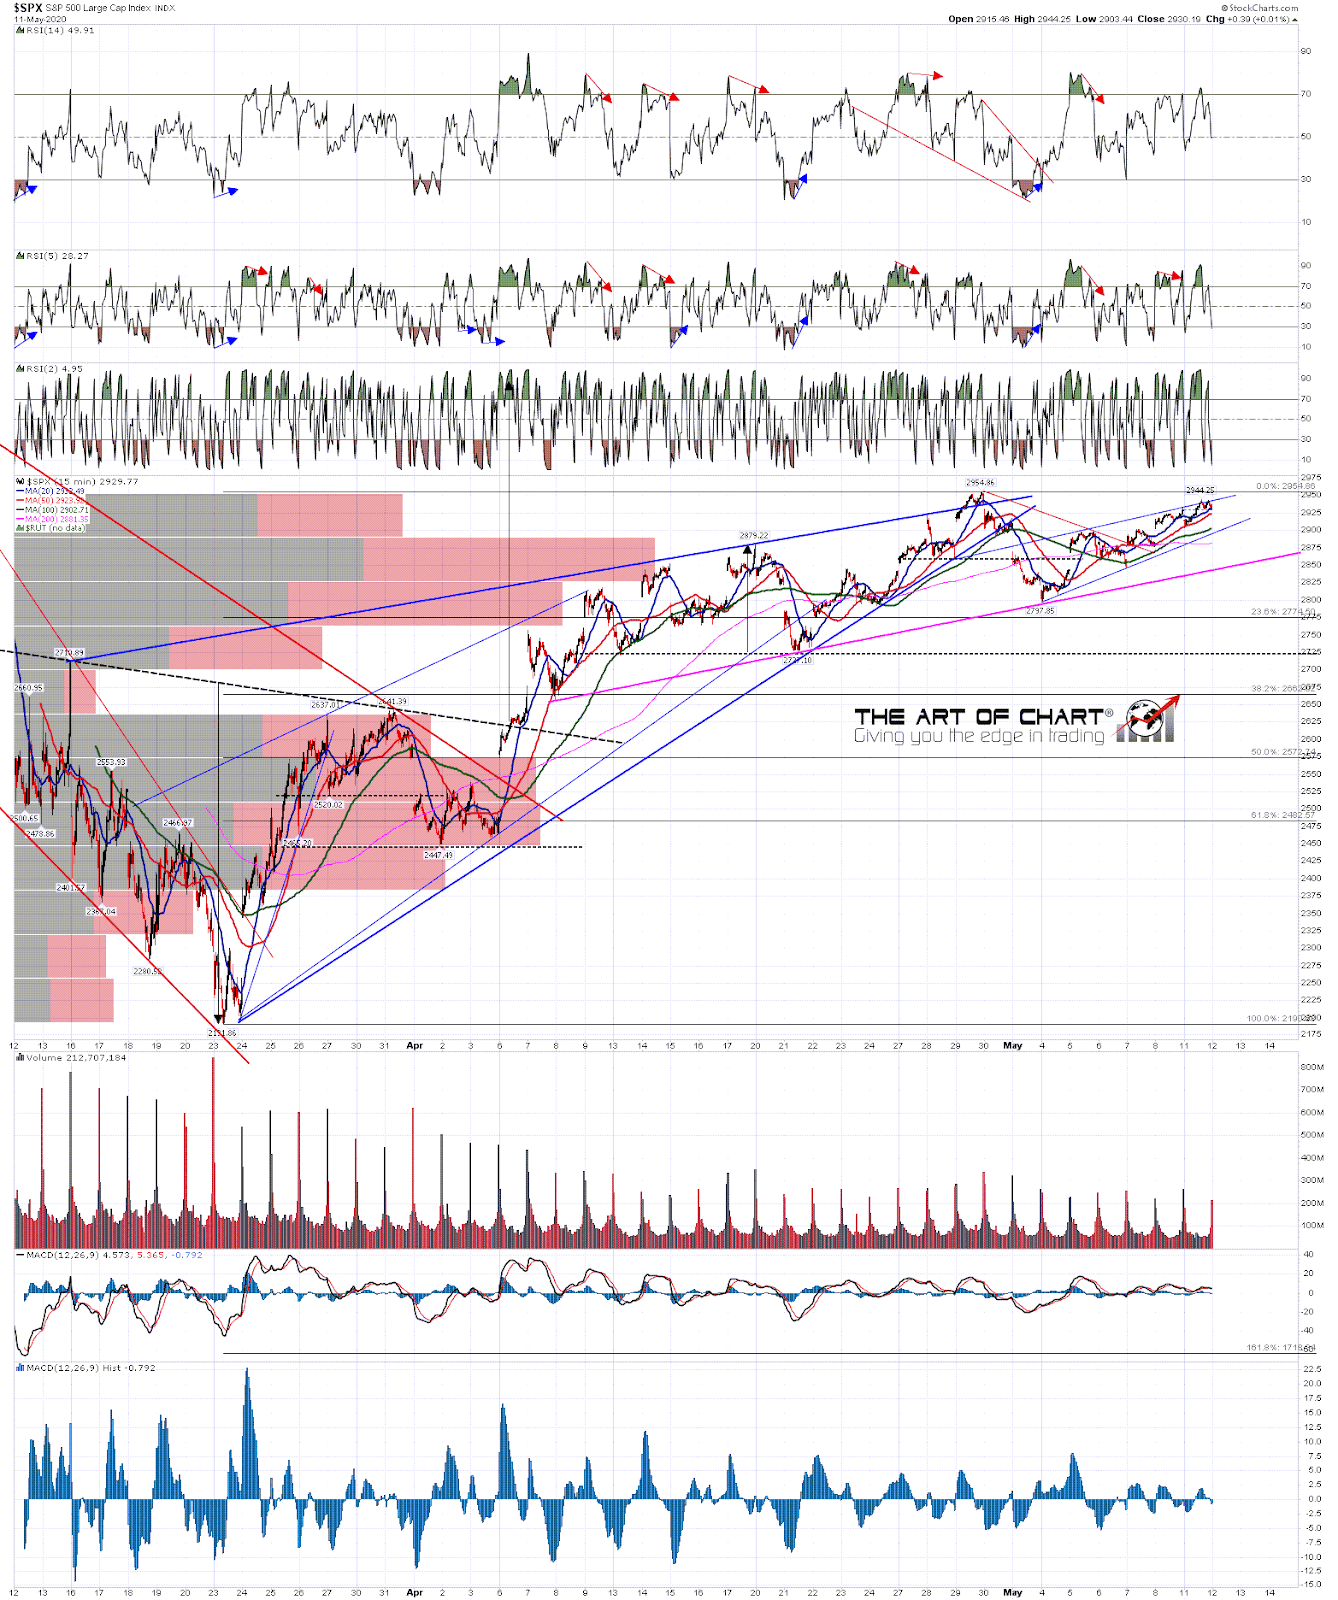
What of this lower high scenario on SPX? Well it looked better at the open this morning when the larger wedge from 2795 had only overthrown once, but the smaller rising wedge within the larger wedge has now overthrown bearishly as well and SPX may be making a lower high here. We’ll see. If so, this could still be a double top setup but the retracement would often be setting up that bull flag or triangle scenario instead.
SPX 5min chart:
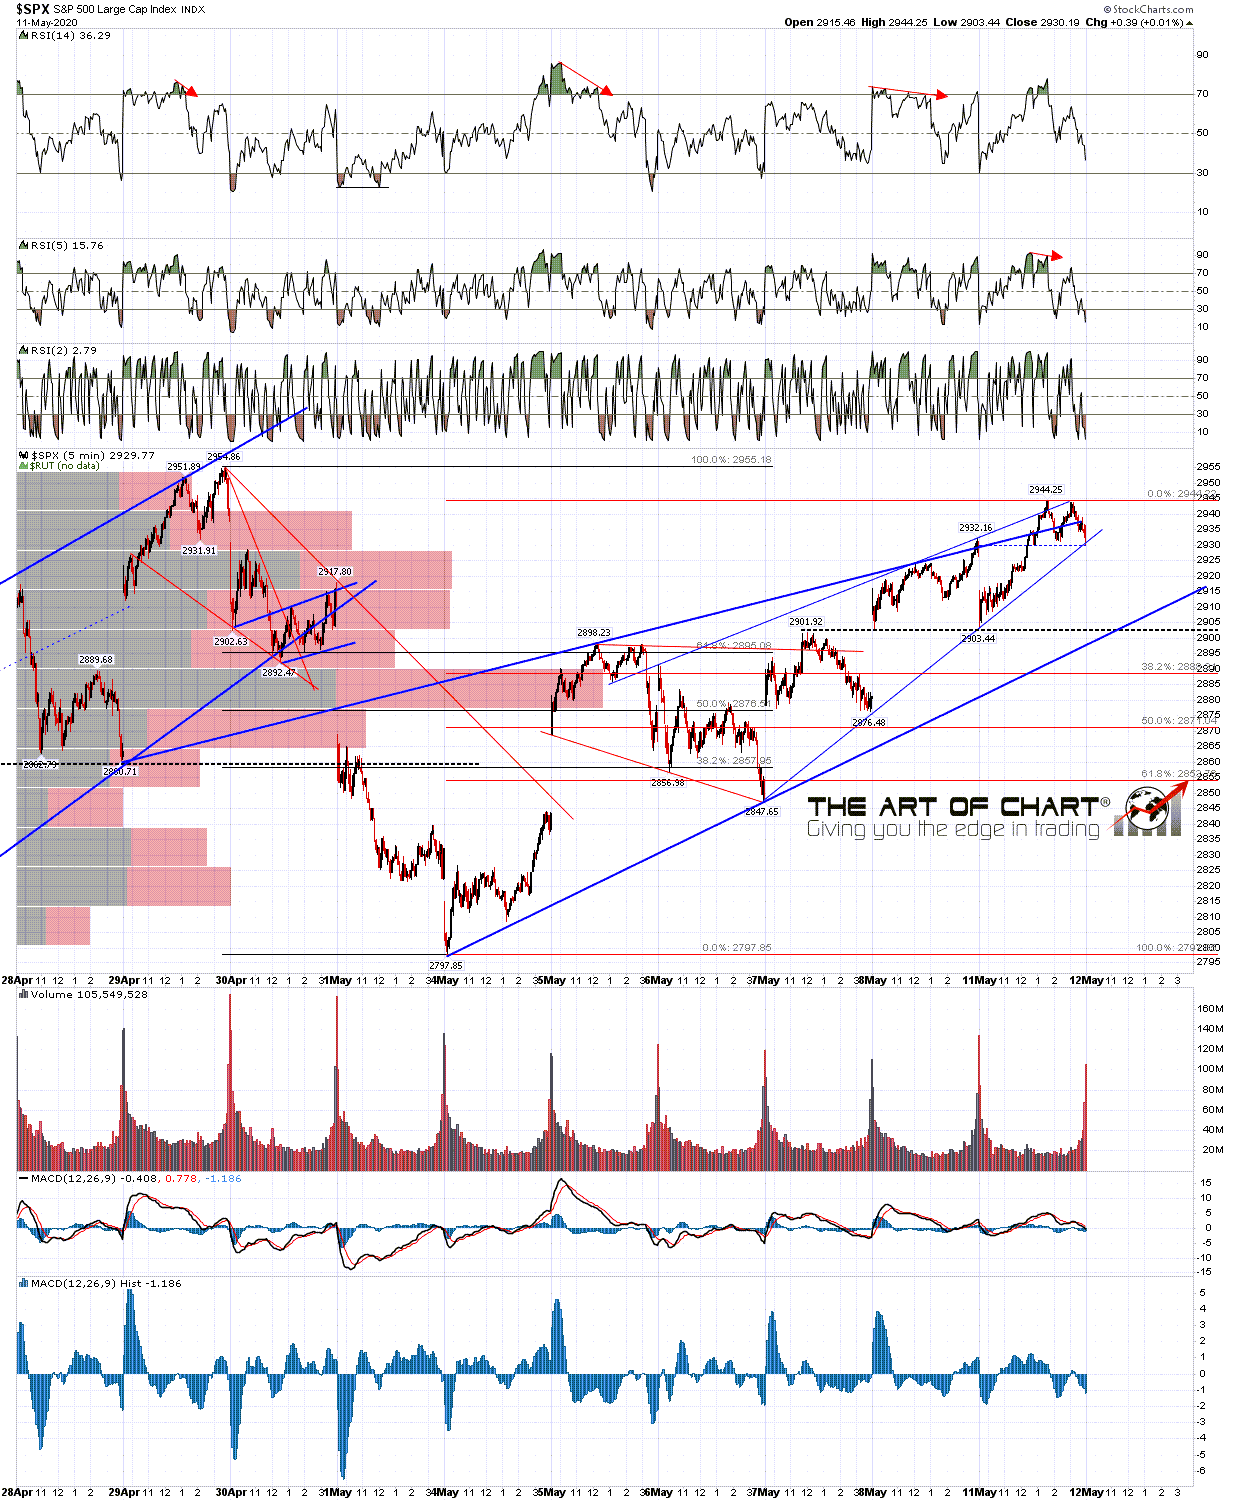
If we do see SPX reverse from here, or a marginal new high over 2954, then the key support levels to be watching first are rising support from 2795, that closed today in the 2897 area, the 5dma, that closed today at 2891, then the weekly pivot at 2886, then the 50 hour MA, that closed today at 2879. If all these can be broken then the main support is the daily middle band that closed today at 2851. If that can be broken and converted to resistance the downside opens up. As long as that remains solid support SPX can go higher and might. The obvious resistance levels above are the current rally high at 2954 and up to twenty or so handles above, then the 3000 area, with a decent break over 3000 opening the path to the !HS target in the 3115 area.
Stan and I are doing a webinar after the close on Wednesday at theartofchart.net from our series on trading commodities. If you’d like to attend then you can register for that on our May Free Webinars page.
 11th May 2020