SPX didn’t quite reach the 3290 bull scenario target area that I was talking about last week but made a respectable 3280 or so before rejecting back into a retest of the established support and possible H&S neckline in the 3200 area. The SPX hourly RSI 14 sell signal reached the possible near miss target and an RSI 5 buy signal has now fixed.
Interestingly the high last week established a possible new rising wedge resistance trendline from the March lows, which is a development that I’m watching with interest, as the retracement since has broken rising wedge support and has put SPX into a possible topping process.
SPX 60min chart:
In a topping process the first thing I look for is the formation of a reversal pattern, and there is a very nice H&S that may be forming at the moment. The ideal right shoulder would be in the 3240 which is pretty close to the 3237 area high today at the time of writing. A sustained break below 3200 would look for the 3120 area, but the break down might fail at the daily middle band, which held the last two retracements and is currently in the 3186 area.
Against a reversal directly from here on SPX though I’d note that neither the hourly RSI 5 buy signal nor the 15min RSI 14 buy signal has made the possible near miss target area yet, and none of the open hourly buy signals on ES, YM, DAX or ESTX50 have reached those either, though the hourly buy signal on NQ has reached the possible near miss target.
SPX 15min chart:
 Further downside looks promising on the NDX daily chart, where the RSI 14 sell signal finally fixed last week.
NDX daily chart:
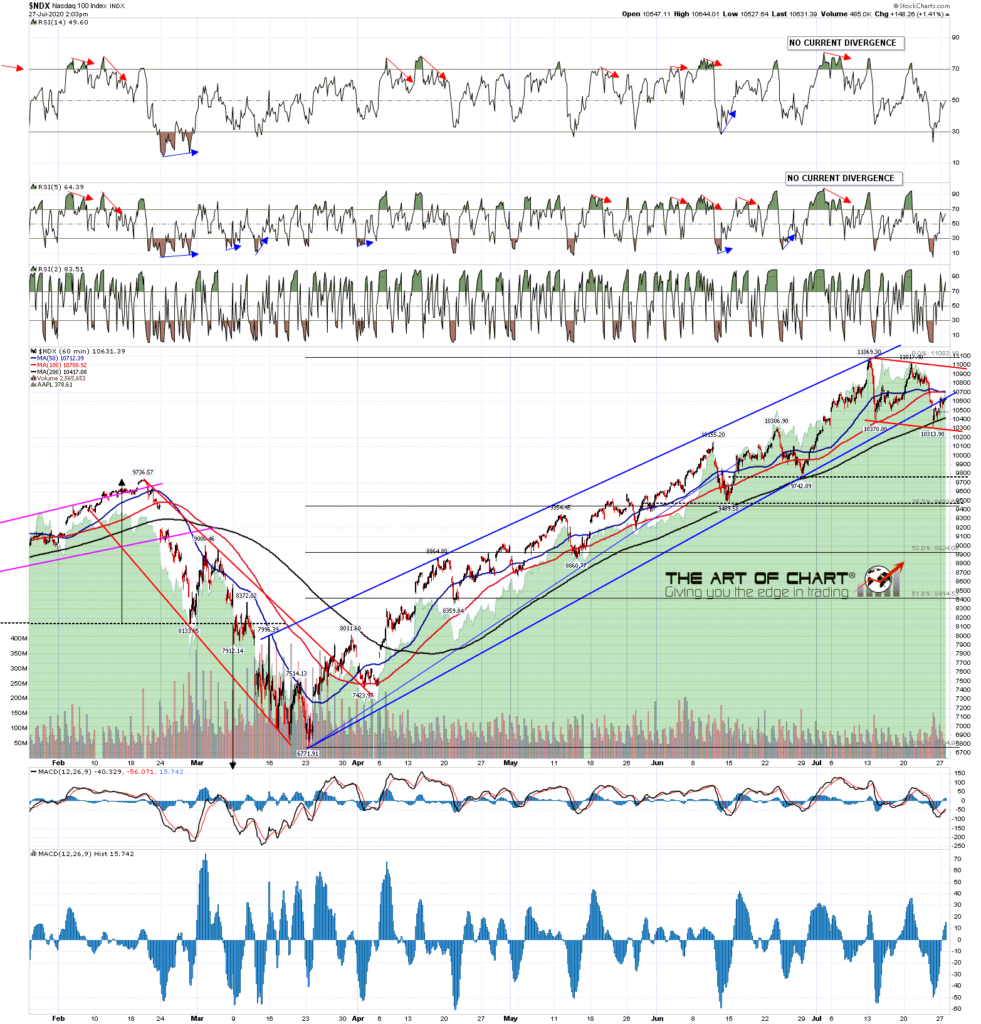
 ….. though I’d note the perfect bull flag channel on the NDX hourly chart that is suggesting a high retest. NDX needs to break that channel support to open the downside.
NDX 60min chart:
The DOW chart also has me wondering about a high retest here, with a perfect test and hold of rising support from the late June low at Friday’s low. That too needs to break to open the downside.
INDU 15min chart:
In summary there’s a very nice scenario to retrace back into the 3100-20 area here on SPX and that may well be part of a larger topping process as evidence mounts that there will be no V shaped economic recovery from the COVID-19 pandemic. We’ll see how that develops and if SPX breaks back over the 3260 area I’ll be leaning towards a retest of last week’s high on SPX, NDX and Dow.


 27th Jul 2020