
The high earlier this year was at the main resistance trendline on SPX, starting at the low in March 2009, support at the low in 2010, broken as support in 2011 and then backtested as resistance then and several times since. The high yesterday was just shy of a full test and that has broken on the move up today, with visible breaks on both the weekly and monthly charts. That may just be a bearish overthrow on the bigger picture but it is still a huge break.
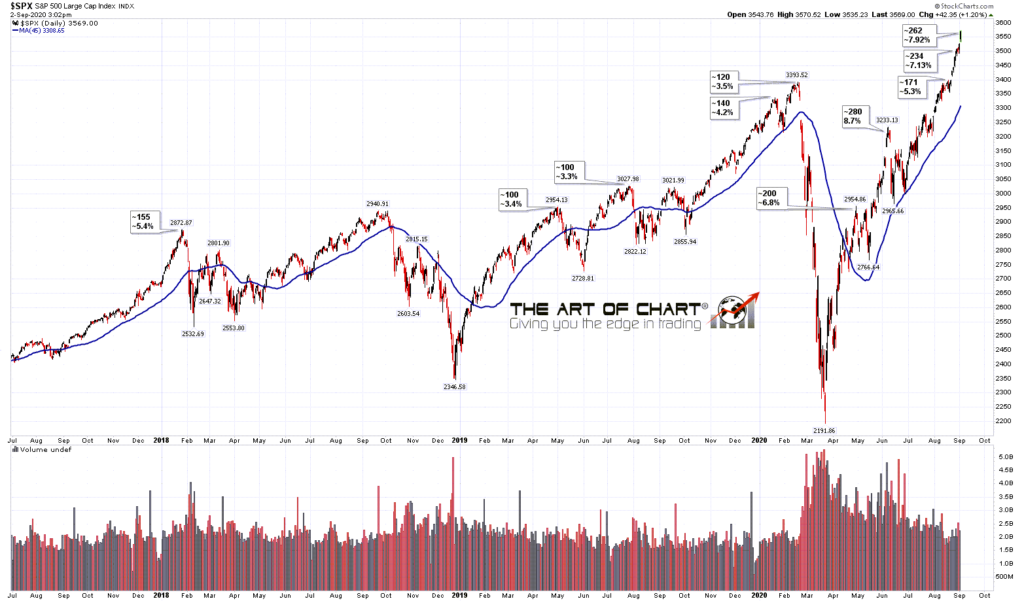
In the short term SPX is now about 8% over the 45dma, approaching the 8.7% over the 45dma reached at the June high, which was the most extreme high on SPX relative to the 45dma since 2013, though there may possibly have been more extreme highs before that I haven’t identified yet. This is a very extreme level and a retracement to the mean high must be close, and could be forming now.
SPX daily vs 45dma:

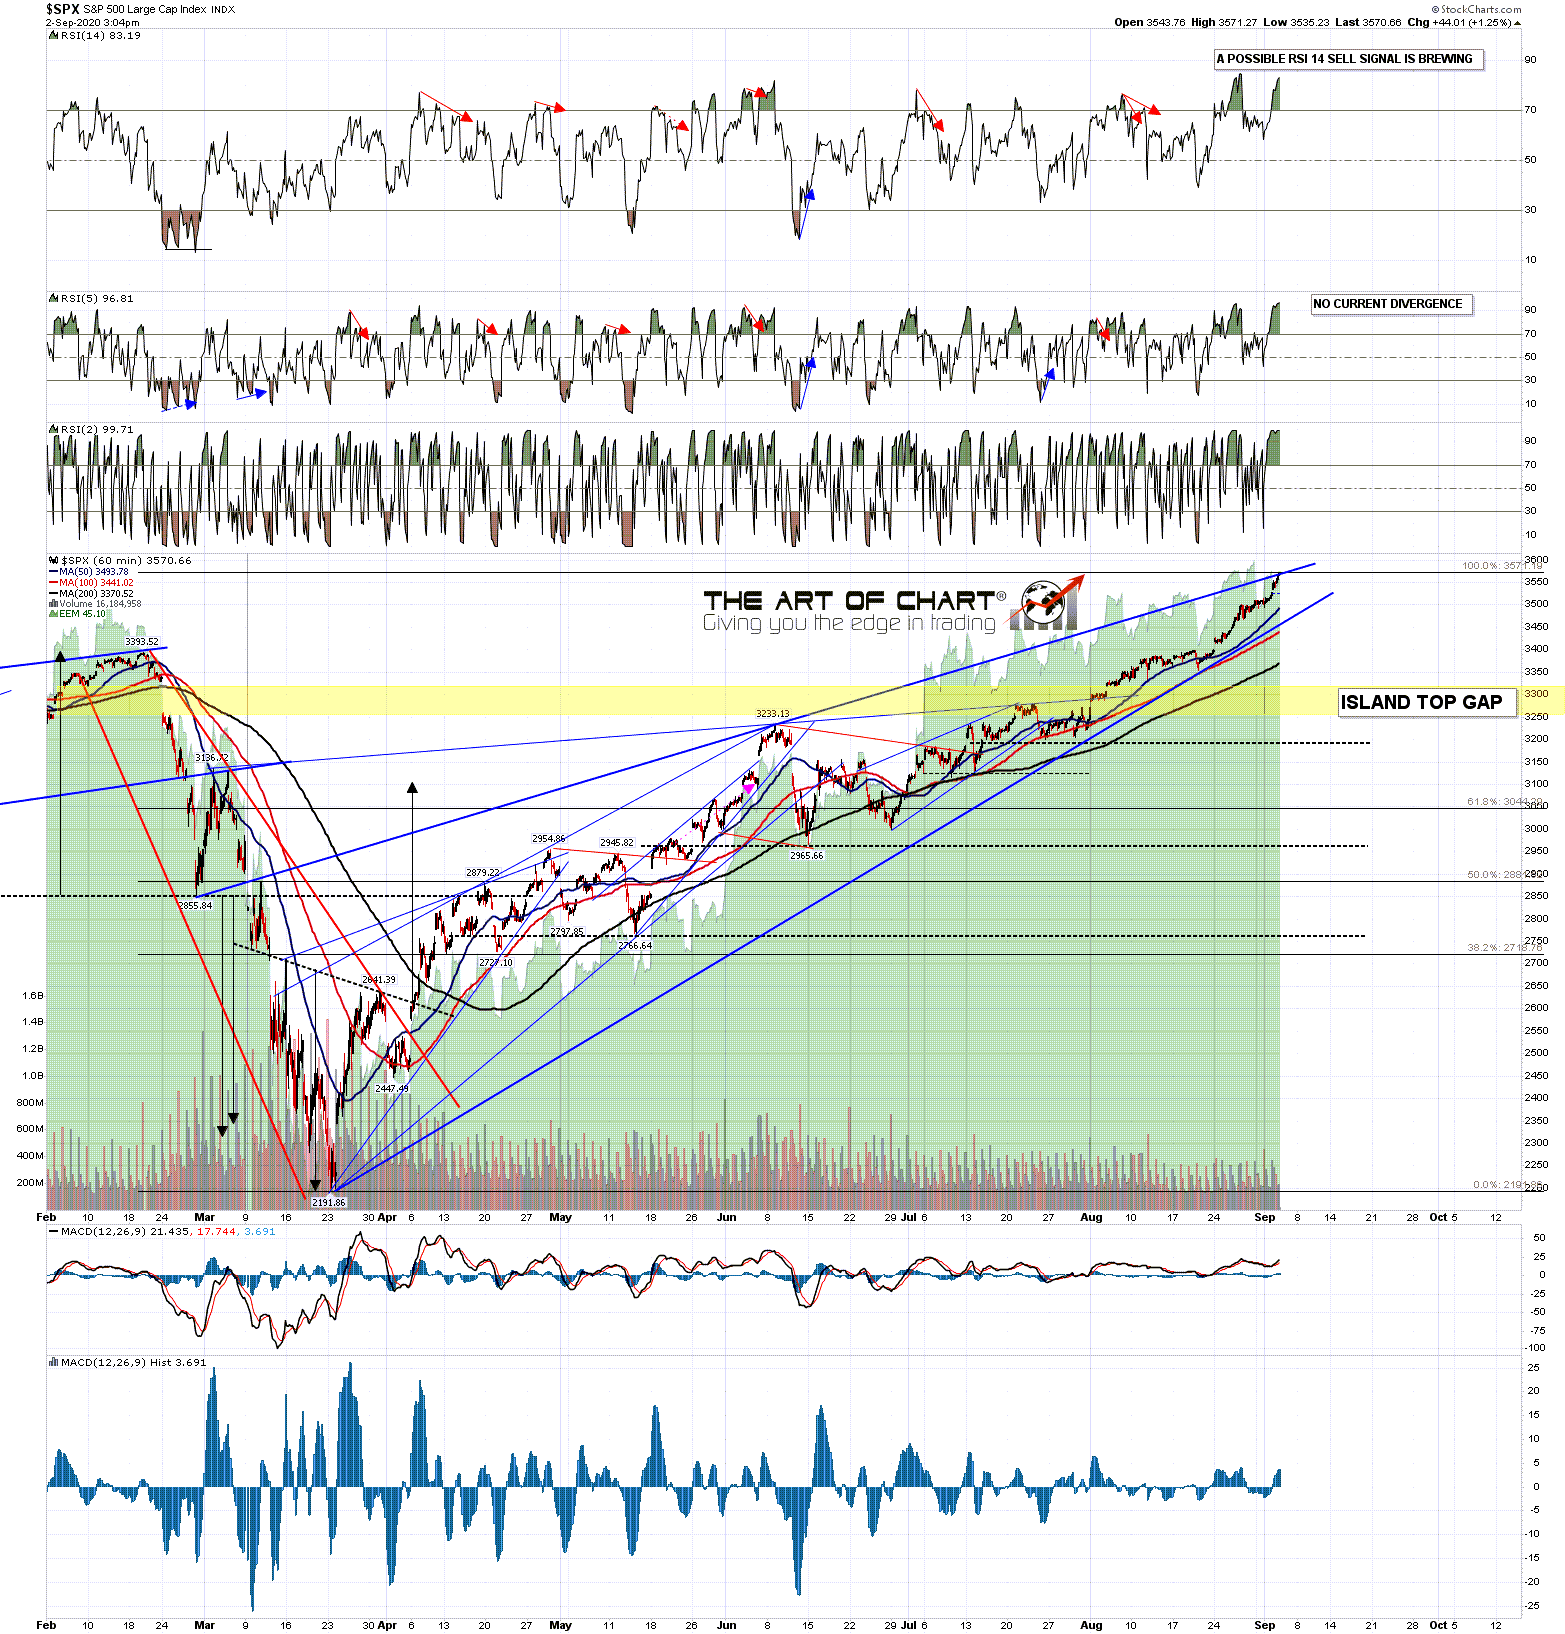
I was watching another much shorter term trendline on SPX for the move up from the March low. That is overthrowing slightly as I write and unless SPX retraces a bit before the RTH close the RSI 14 divergence on the SPX hourly chart may be lost.
SPX 60min:
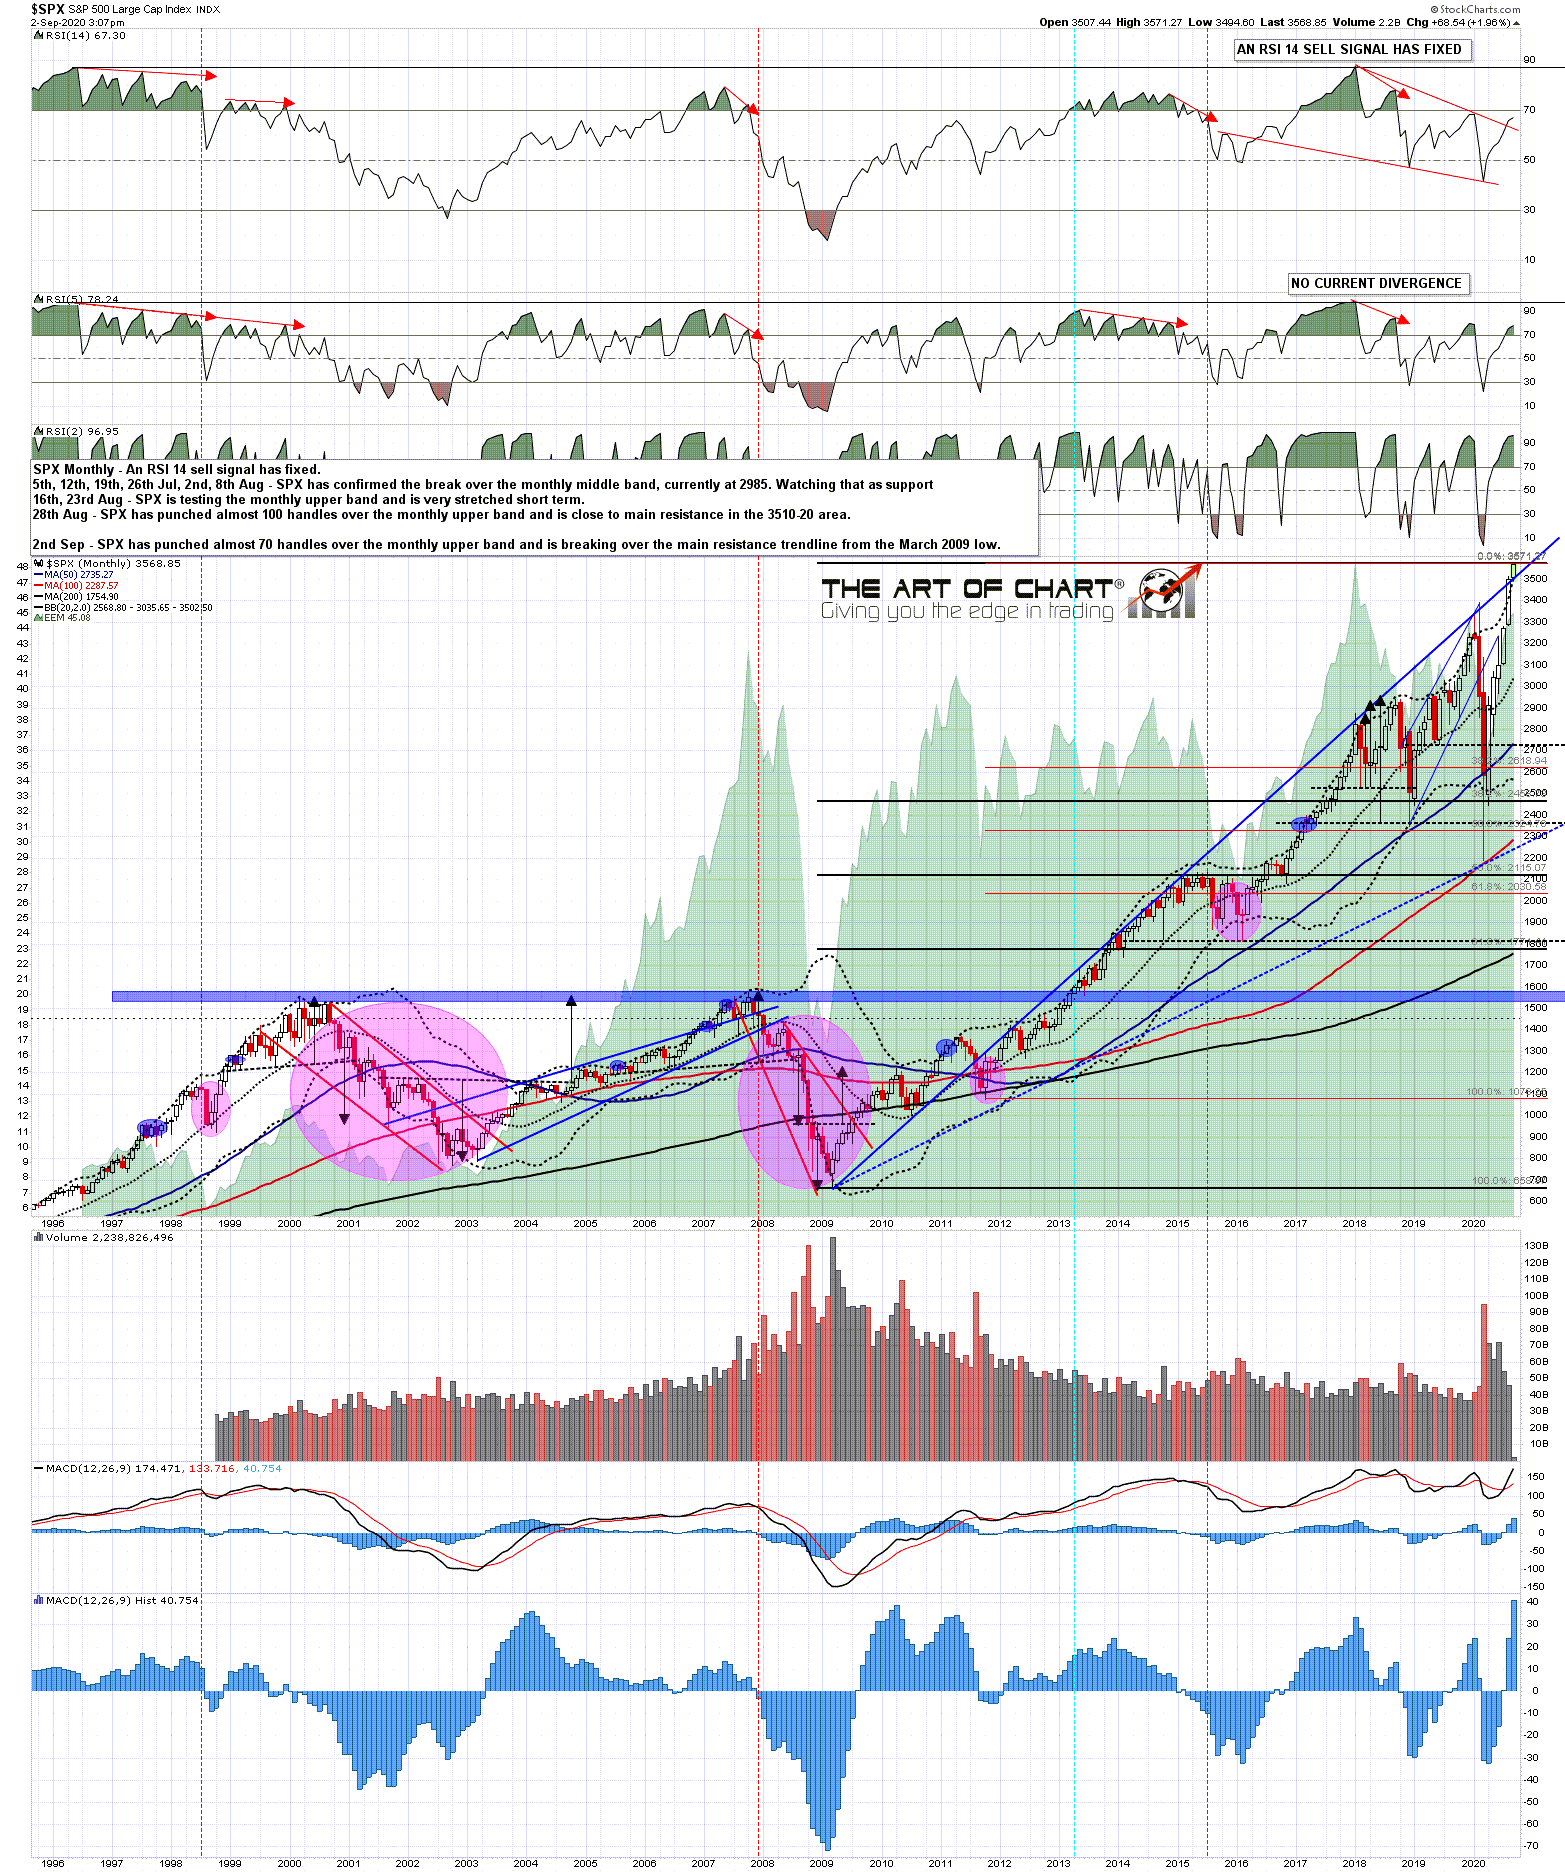
On the SPX monthly chart there is now a clear break over the main SPX resistance trendline. If that is a bearish overthrow a clear and strong rejection would be best in the very near future.
SPX monthly:
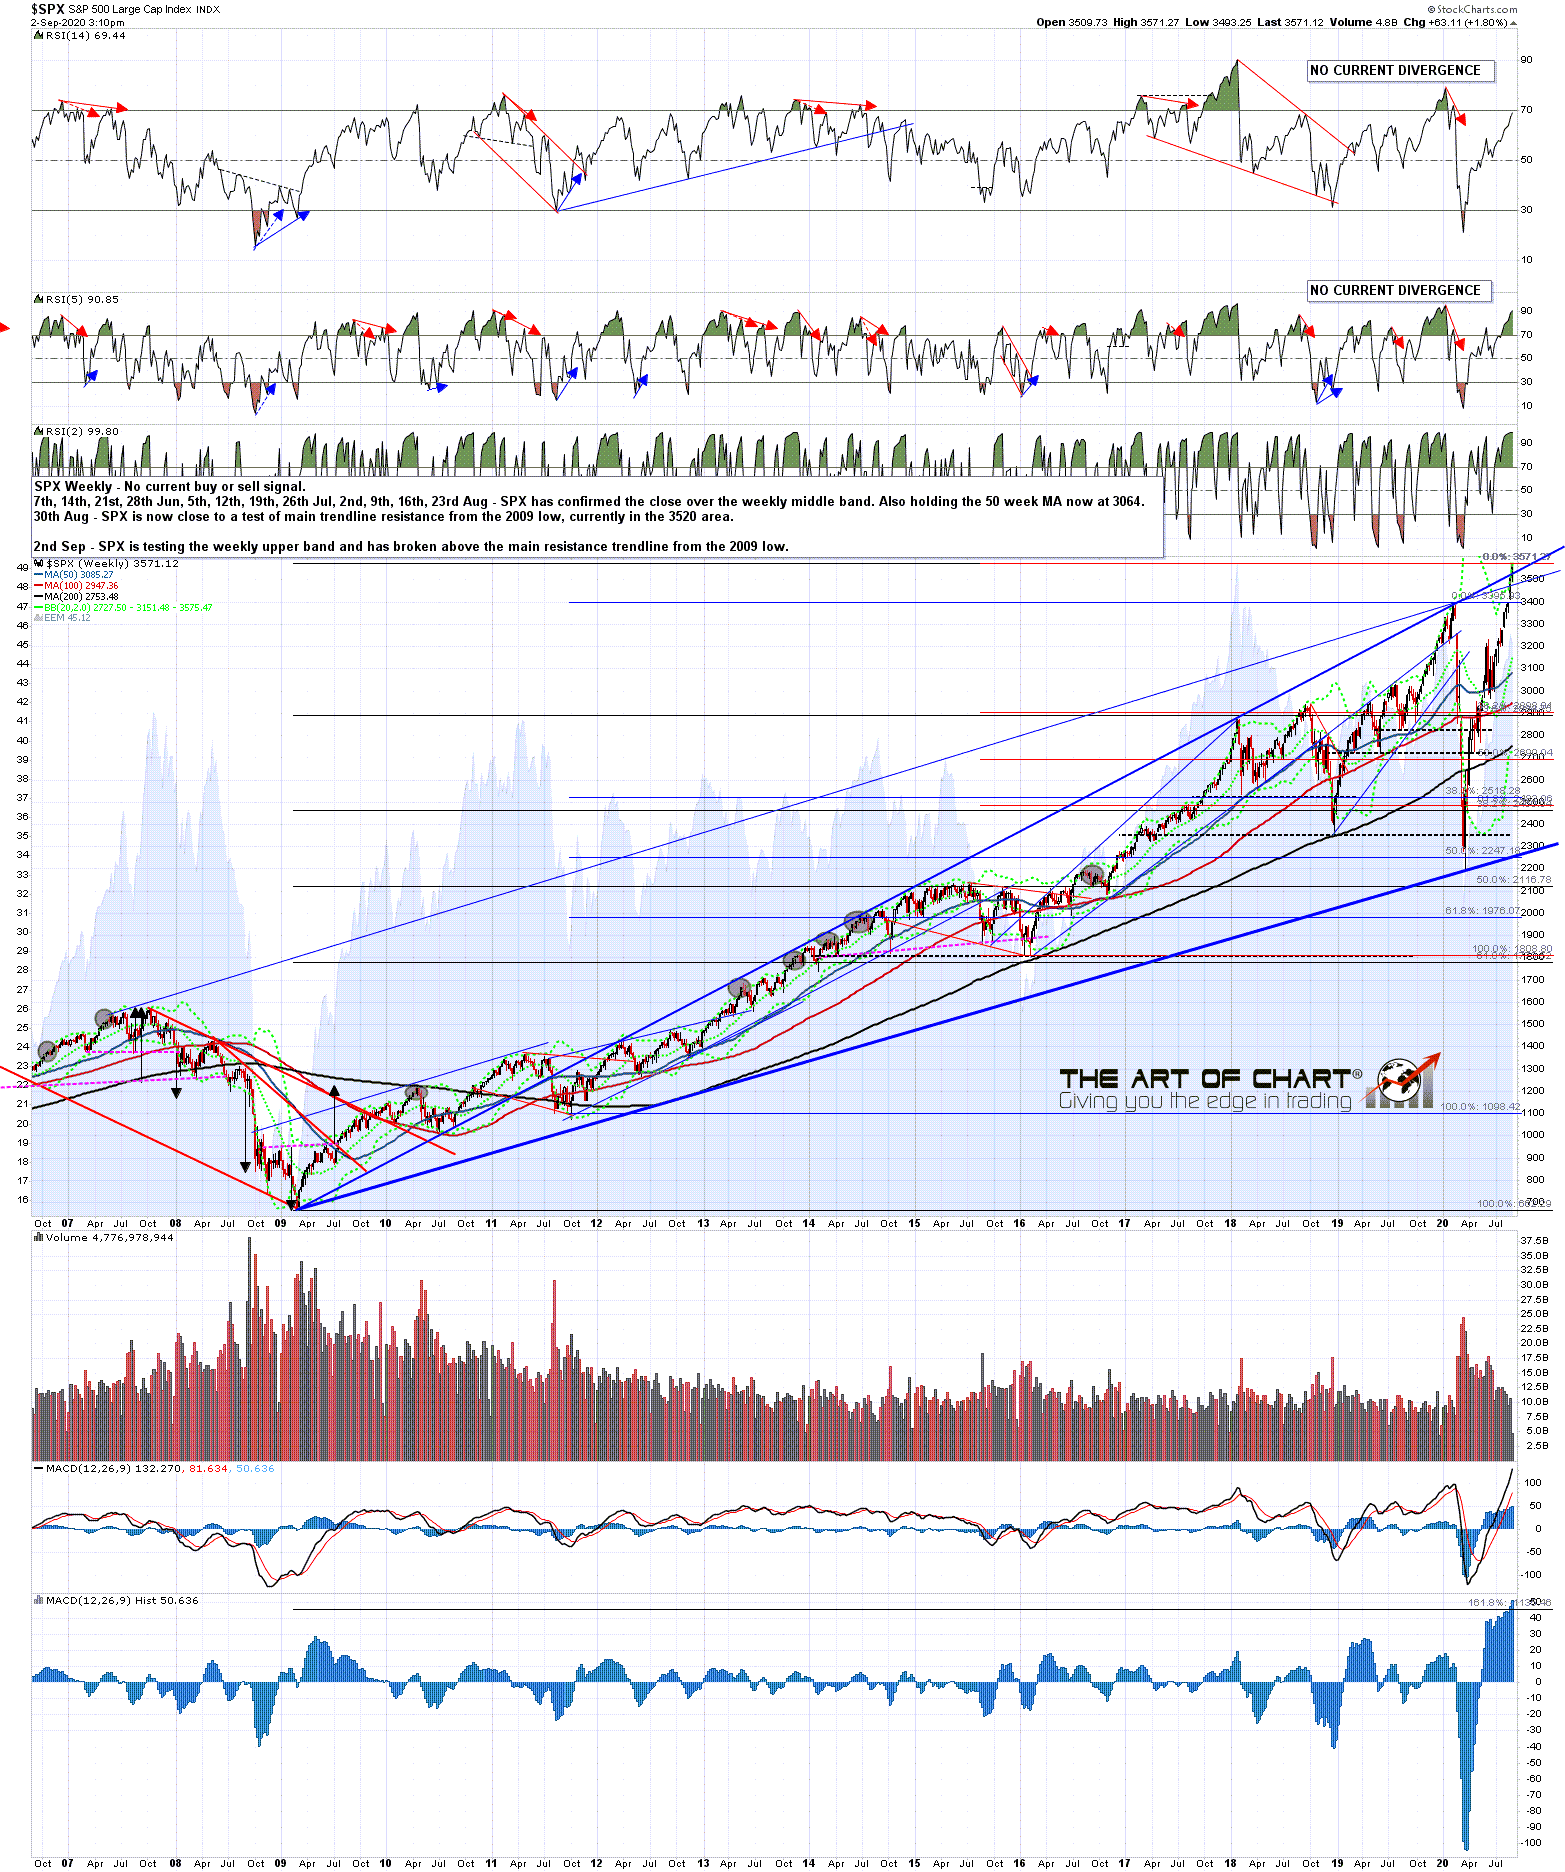
On the SPX weekly chart there is also now a clear break over the main SPX resistance trendline. If that is a bearish overthrow a clear and strong rejection would also be best in the very near future.
SPX weekly:
The main driver of this move is of course NDX with the SPX equal weight chart finally managing just to retest the June high at the highs today. The Russell 2000 has also barely participated in the rally over the last couple of weeks.
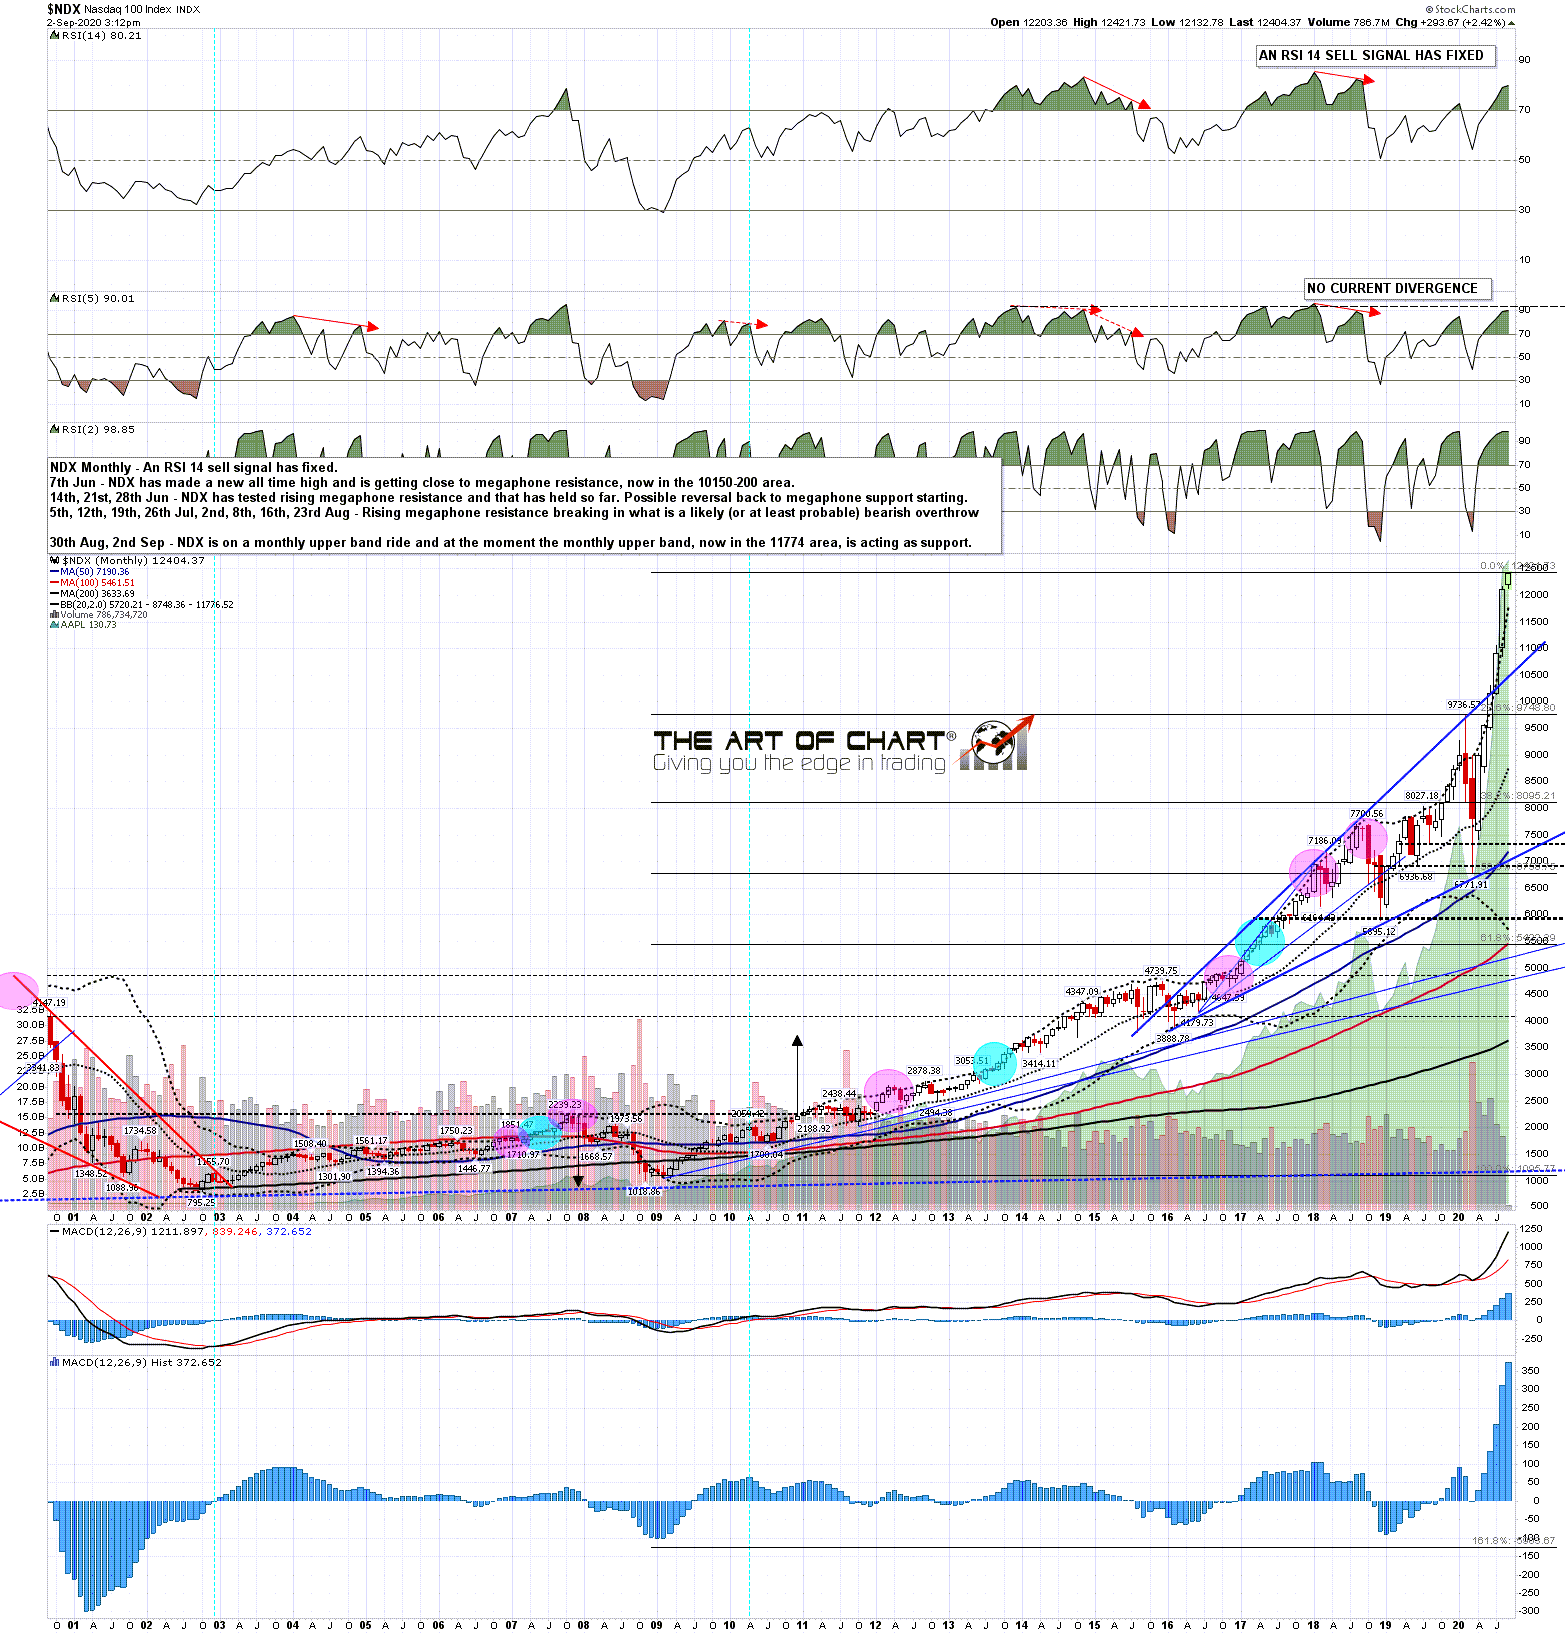
NDX is on a massive tear, on a monthly upper band where the monthly upper band has acted as support since the start of July. Until there is a significant high on NDX, SPX might continue to be dragged up with it.
NDX monthly:
As I’ve been writing SPX has continued higher. If this high was to reach the same level of extreme as it did in June that target would be at 3597 today. Stan and I are doing our monthly public Chart Chat on Sunday and if you’d like to attend you can register for that on our September Free Webinars page.
 02nd Sep 2020