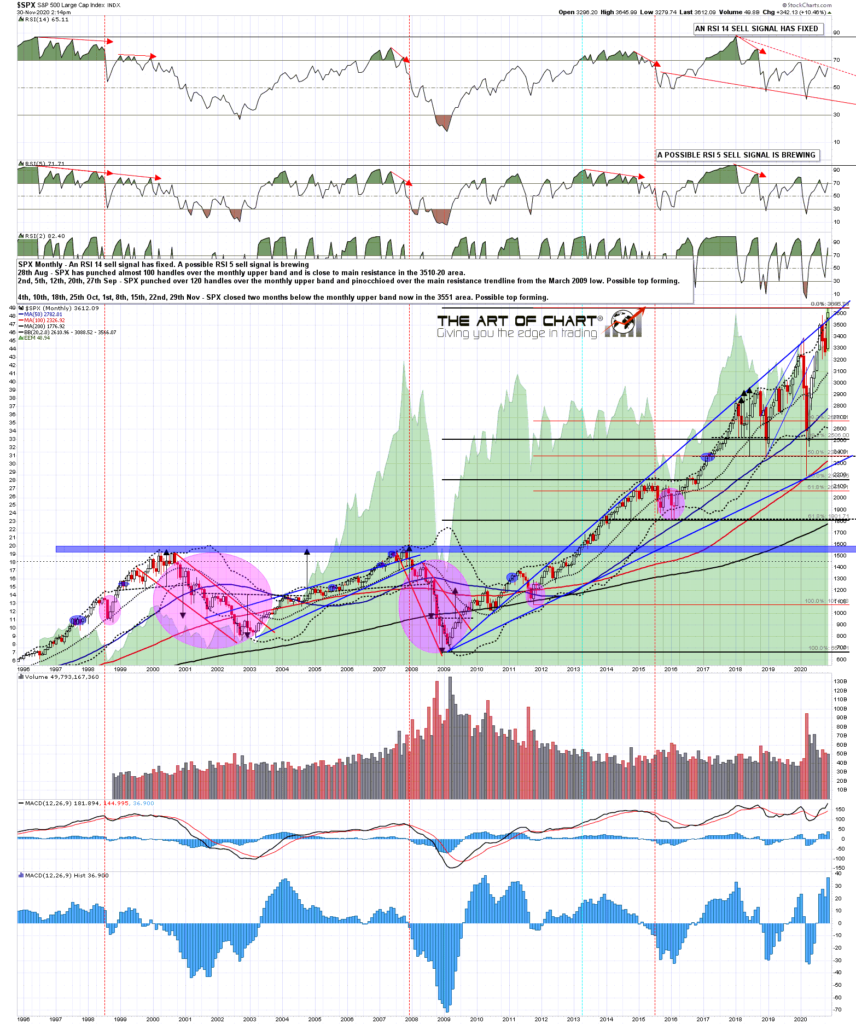
November is about to end and SPX is likely at the time of writing to do something not previously done in the last twenty five years, which is to close a long way above the monthly upper band, currently 3566 area, only three months above the last strong punch close above in August. What does this mean?
Well on NDX this would give about 40-45% odds that the market would then deliver a series of closes at or above the monthly upper band in coming months, but while that is possible on SPX, historically there would be little precedent for it. The odds still favor a close at or below the monthly upper band at the end of December, at which point it would be unlikely to be over 3600.
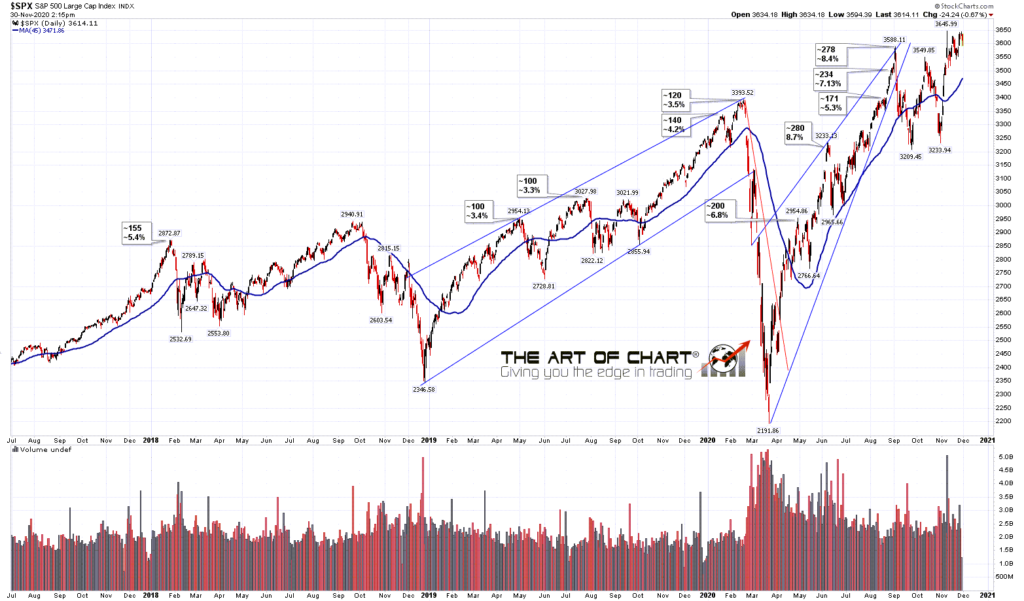
In terms of the SPX 45dma, the current all time high was made almost 10% over the 45dma, the highest of a lot of very high readings since the March low, and SPX is still very stretched to the upside by historical standards.
SPX daily 45dma chart:
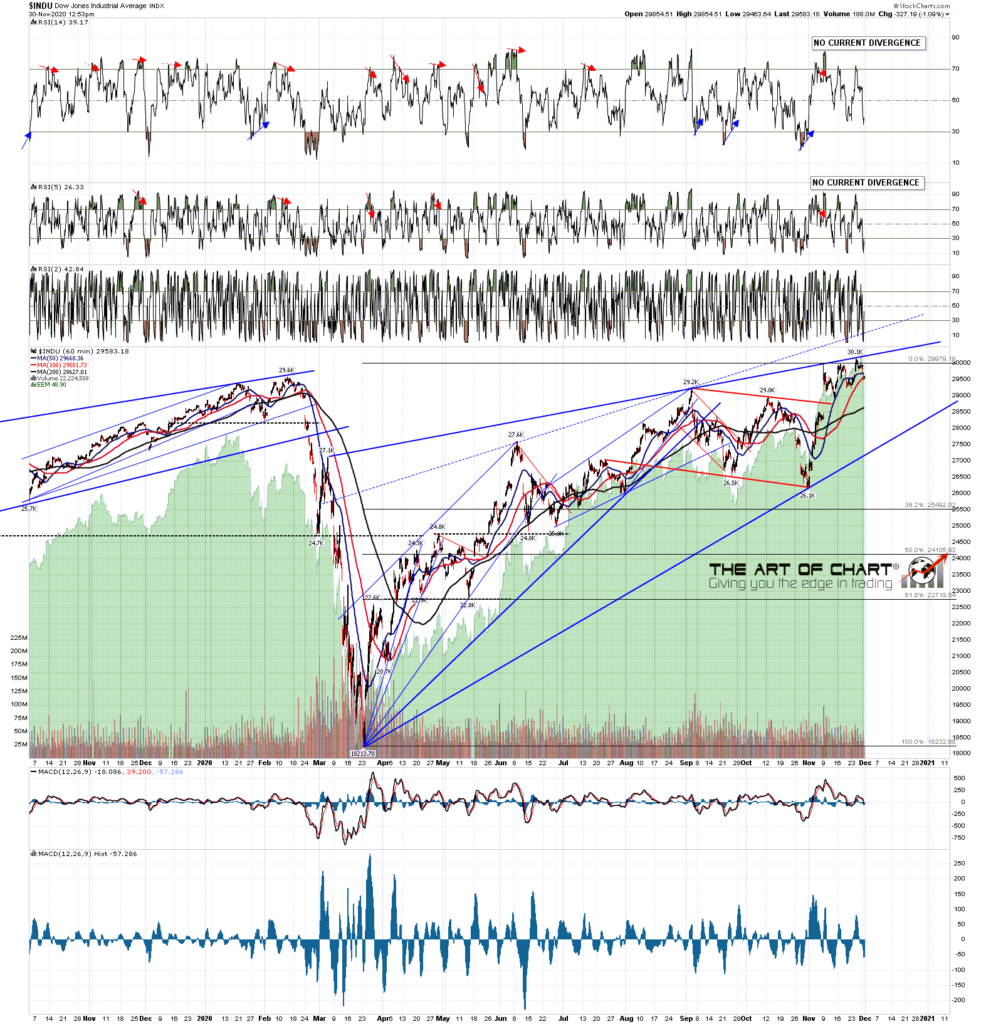
In terms of pattern setups the best current pattern from the March low is on the Dow industrials chart where that appears to be topping out in a high quality rising wedge. The action here seems to favor downside soon, with a daily RSI 5 sell signal already fixed on both this and the SPX chart, but that might need another high retest before reversal.
INDU 60min chart:
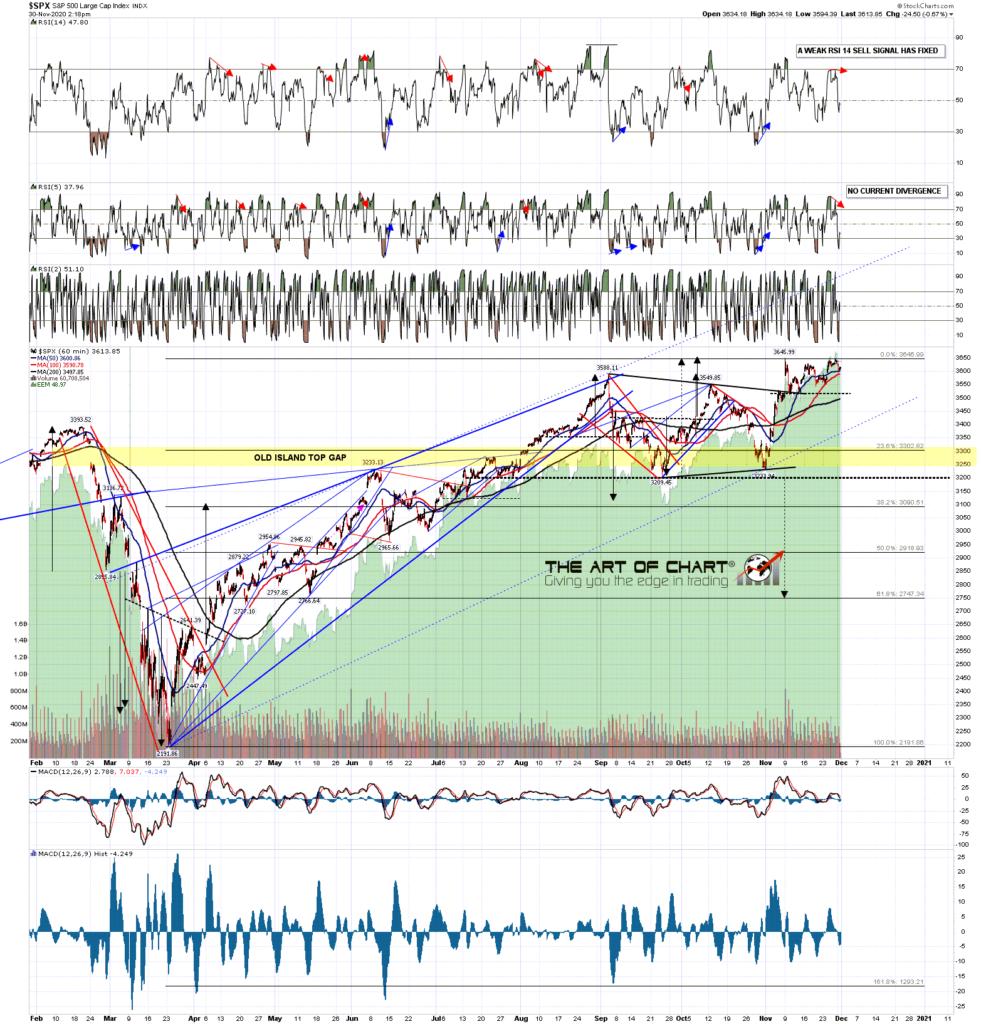
On SPX and ES retests of the all time highs were just missed on both and, together with a retest of the all time high on NDX, look like unfinished business above. That unfinished business could be finished later of course, but I’d expect to see those retests at most within a few weeks. SPX 60min chart:
In the short term the current retracement from the high on ES looks like a bull flag, so we may be seeing those all time high retests in the next day or two, after which I’d be looking for at least some retracement back into the mid-3500s. A significant high may be forming here. ES Dec 60min chart:
The historical stats for last week leaned bullish but the stats for this week lean bearish including, unusually, the first day of the new month tomorrow. Looking for a retracement to start soon, ideally after those all time high retests.
I would also mention that we have been running our usual Black Friday sale on annual memberships at theartofchart.net until the end of November, and have extended that slightly until the end of Tuesday 1st December. During this sale we are offering four free months on an annual membership against normal monthly prices. We never raise subscription prices for existing members as long as memberships are renewed without breaks, so if you are thinking of getting an annual membership to theartofchart.net, then this is the best time to do that.
Our December Free Webinars page has been posted and I’d mention that our free monthly public Chart Chat is at 4pm EST on Sunday 6th December. We are also offering a free week this week on our Vega Options Service for anyone interested.


 30th Nov 2020