I was saying in my last post on Friday afternoon that the low made that day looked nice, with touches of the daily middle band and shorter term (from Nov low) rising wedge support on SPX. I was leaning towards seeing a retest of the all time high, which we have seen and more.
Now the rising wedge support touch on Friday was confirmation that the obvious rising wedge resistance trendline was the obvious target on a break up to a higher high with any confidence, and that was tested in the last hour yesterday, and then retested at the high this morning. That second retest held the resistance trendline again and SPX reversed on a high quality 15min RSI 14 sell signal:
SPX 15min chart:
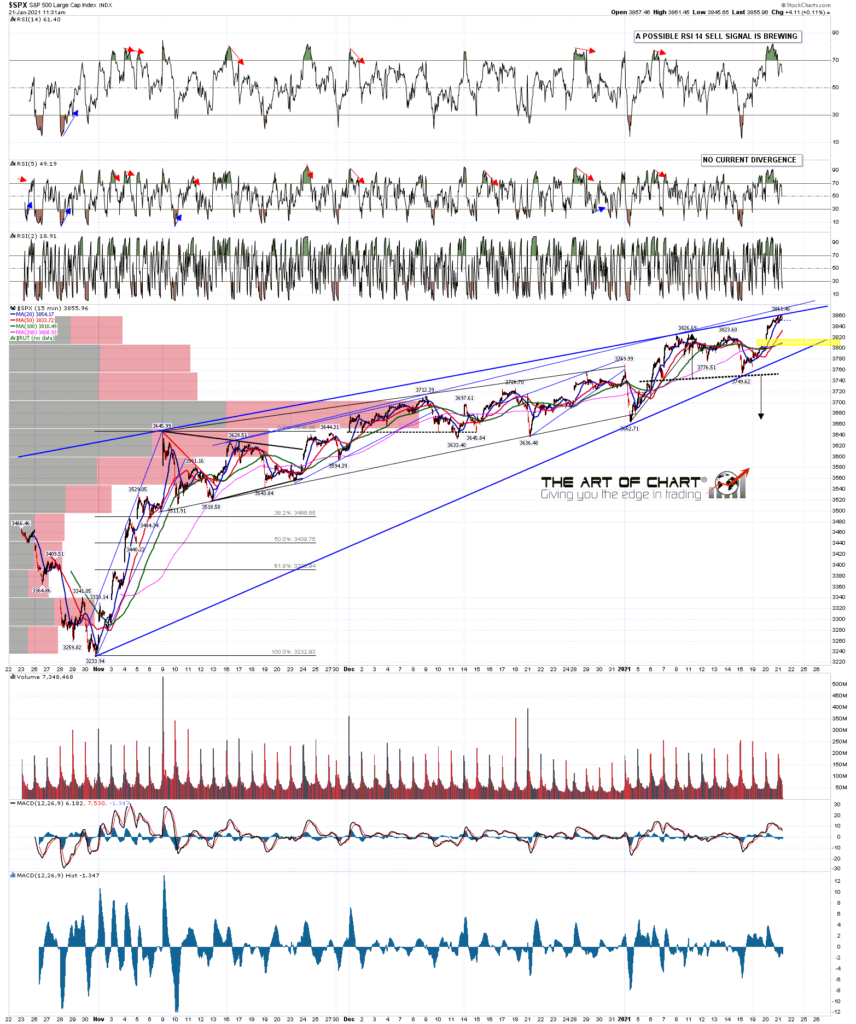
Is anything missing from a topping setup here that I would like to see? Yes, as I would like to see clear negative divergence on the hourly RSI 14 . That can be done with a retest of the a new all time high established on SPX today and at the time of writing it looks as though that may happen in the next few minutes.
If we see the reversal here the first obvious target would be this rising wedge support, now in the 3785-90 area. On a break below, main rising wedge support is now in the 3590 area.
SPX 60min chart:
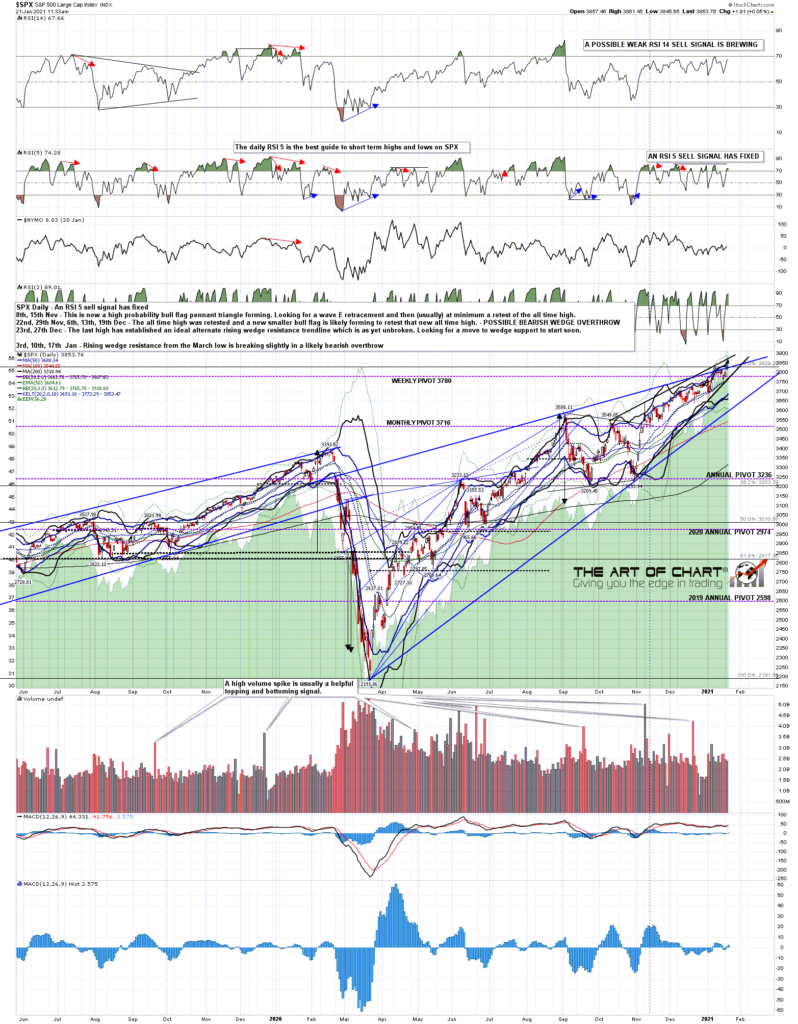
The biggest support level here is the daily middle band, now in the 3765 area, and there has not been a daily close below that since early November. If we are to see a mean reversion to the 45dma, now at 3696, or main rising wedge support in the 3590 area, the we need to see a daily close below the daily middle band as the first step, and then conversion of that level into resistance. A weak daily RSI 14 sell signal is now brewing.
SPX daily chart:
We are have started the year’s first Trader Boot Camp at theartofchart.net on 18th January and this is extremely competitively priced and covers a lot of territory. It isn’t too late to join and if you are interested then you can read more about that here.
Stan and I are doing our monthly free webinar on the Big 5 & key sectors tonight an hour after the close today and if you are interested in seeing that you can register for that here, or from our January Free Webinars page.
Stan and I were doing a free webinar an hour after the close last Friday at theartofchart.net looking at interesting trades on commodities using (mainly) options strategies, but that had to be delayed a week as Stan’s wife fell and broke a bone so if you’d like to attend that an hour after the close tomorrow then you can register for that here.
On SPX this is really a very nice setup for reversal as soon as we see the all time high retest. Pretty decent even without that. Could price just bulldoze higher anyway? Sure, any setup can fail, however nice, but I’m looking for at least a decent retracement here back into wedge support now in the 3785-90 area. We’ll see if we get that.
 21st Jan 2021