Since my last post we have seen what may be the full backtest on SPX that I was looking at then, but might only be the first leg of that backtest.
The backtest did not quite reach the 3950-4025 target zone, and none of the three obvious targets were hit at the weekly middle band, currently in the 3980 area, or either of the rising support trendlines from the March 2020 and October 2020 lows (shown below), and the daily RSI 14 sell signal did not make target so I’m leaning towards another leg down, that could happen after an all time high retest to set up a possible double top.
SPX daily chart:
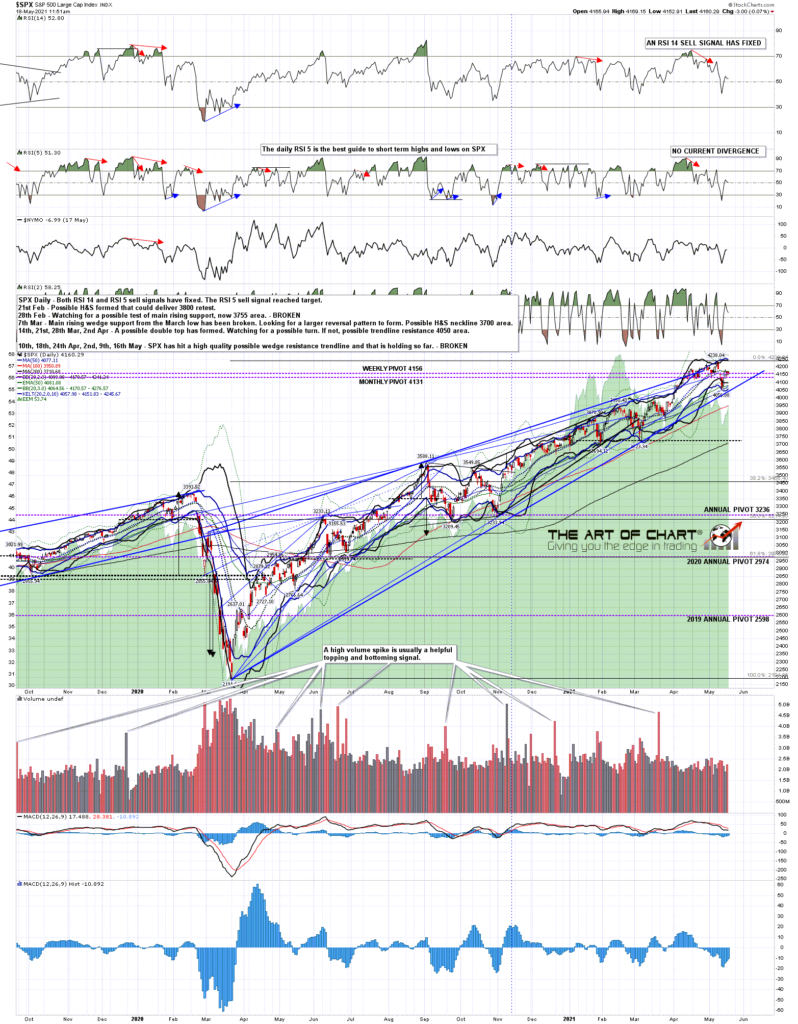
The main rising support trendline is the one from the March 2020 low, but that is in the 4050 area, higher than the target zone in the 3950-4025 area. Possible support if hit.
SPX 60min 15Mo chart:
Rising support from the October low is now in the 4025 area.
SPX 60min 9Mo:

In the short term I did an intraday video at theartofchart.net today looking at the short term bull flag channel on SPX. Channel support doesn’t necessarily need to be reached before that breaks up, but that’s been the pattern that SPX has been trading within today so far.
SPX 5min chart:

Bigger picture I am wondering about a possible all time high retest coming next, and then a move into the ideal backtest area as that pattern breaks down, at which point the double top could either make target (3870 area), which would be a serious support break, or fails and rejects back up into the all time highs, at which point the 4000 area would have been converted into support.
There are two free public webinars at theartofchart.net this week and the first is our ‘Big 5 – FAANG Stocks and Key Sectors’ webinar and hour after the RTH close on Thursday 20th May, and our ‘Trading Commodities – Setups and Approaches’ webinar an hour after the close on Friday 21st May. If you’d like to attend either or both you can sign up for those here and here respectively.
 18th May 2021