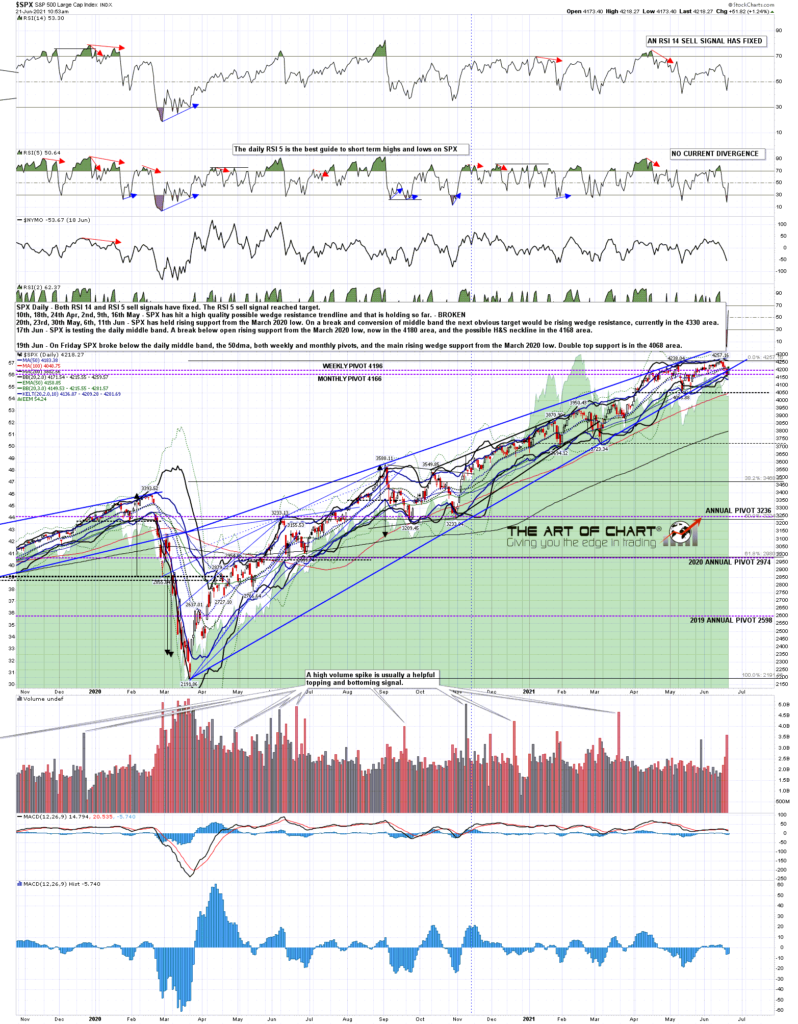
Friday was very weak, particularly for a big opex Friday, and SPX broke down through the daily middle band, currently 4215 area, the 50dma, currently 4183 area, and on ES even briefly broke down below the monthly pivot. We are seeing a rally this morning and I was giving the ideal rally high area on my premarket video at theartofchart.net in the 4230-5 SPX area. The odds look good for a reversal there into lower lows.
SPX daily chart:
On my premarket video on Friday that I posted on my personal twitter on Friday morning I was looking at an ideal low for Friday at a possible H&S neckline. That low was made in the right area and SPX is likely rallying here to form the right shoulder on that pattern. I’m showing that possible pattern forming on the SPX 15min chart below. On a sustained break below the last low at 4164 the H&S target would then be in the 4070-5 area, slightly above main double top support at 4061. That is a level I’m expecting to break, though we’ll have to see after that whether that then heads down to the double top target in the 3865 area, or rejects back up into the highs.
SPX 15min chart:

So far at least, there hasn’t been much weakness on NDX, and I am expecting that to break down too. There is a really nice short term rising wedge there though, and after a possible high retest here I’m expecting that to break down.
NDX 15min chart:
As I mentioned last week, this week is one of the most historically bearish weeks of the year on SPX, and in a few days we will be starting the most bearish four months of the year on NDX. If we are going to see the decent retracement that is setting up here, this is the ideal time to do that. We’ll see how that goes.
Last Friday’s commodity webinar was delayed until Thursday 24th June, so we will now be doing a double bill of free public webinars at theartofchart.net on Thursday starting an hour after the close.
Those two webinars will be firstly the monthly Big Five and Key Sectors webinar covering AAPL, AMZN, FB, GOOG, NFLX, TSLA and eleven sector ETFs. If you’d like to attend you can register for that here. The second webinar, starting half an hour after the first, is the commodity trading webinar. As usual we will be looking at three promising trade setups and designing three options setups to trade those. You can register for that here, and the registration links and recordings for that and the other free webinars this month are also of course on our June Free Webinars page.
We also run an annual July 4th sale at theartofchart.net with an additional 20% off the already discounted price for annual memberships, giving effectively four free months on an annual membership until the sale ends. If you’re interested the sale page is here, and remember you need to enter the sale code JULY4SALE in the checkout process.
I’m expecting this to be an interesting week. If so, I’ll likely do further posts this week on Wednesday and Friday.
 21st Jun 2021