I was looking at something unusual in my premarket video at theartofchart.net this morning and that was a large number of H&S patterns both bearish and bullish. I don’t generally post my work here outside the equity indices but I’ll make an exception today as these are worth a look, and all really coming out of the reaction last week to the Fed indicating that tapering of COVID measures is starting soon in the US.
The first of course is the possible H&S forming on SPX that I was writing about yesterday. This is in the ideal right shoulder area and SPX is now in the inflection point seeing if this will now break down. If it doesn’t I’ll be looking for the high retest, but the historical stats and setup here are favoring a break down.
SPX 15min chart:

There is also a really nicely set up H&S forming on DX which may well complete and break down here. A sustained break below 91.80 would look for the 91.20 area.
DX Sep 60min chart:
The H&S forming on ZB is less clear, and it is hard to tell whether the right shoulder is currently forming, or has already formed and broken down and may be failing. A great target area on a sustained break down though at a retest of the early June low at 155’16.
ZB Sep 60min chart:

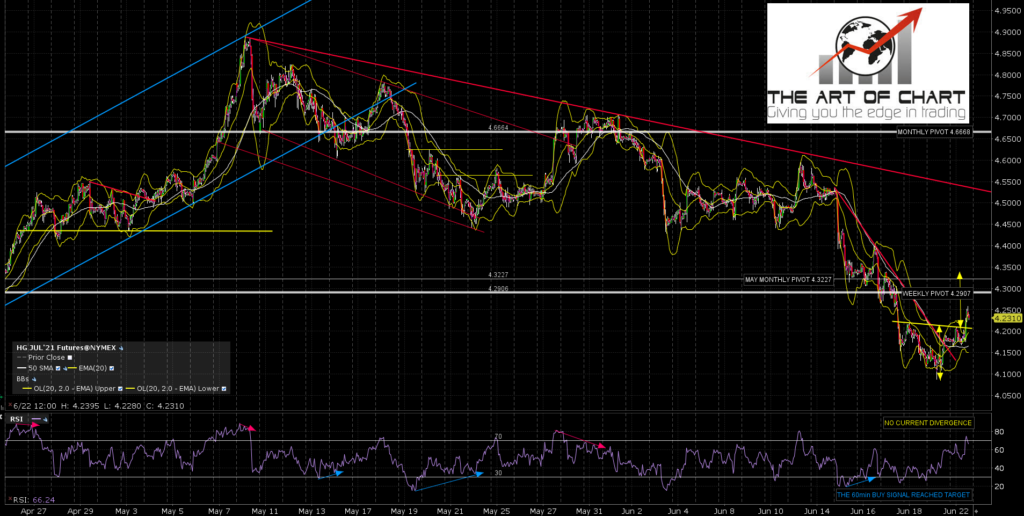
The smaller IHS on HG (copper) has already broken up with a target in the 4.35 area. Again a very nicely formed pattern.
HG Jul 60min chart:
There are other H&S patterns that I haven’t included here. There are decent quality H&S patterns on EURUSD and GBPUSD that has already broken up like HG. There is also a decent quality possible IHS forming on RTH that on a sustained break would have a target back at a retest of the June high there and open a possible retest of the all time high just above that. If SPX breaks higher here I’ll be showing that on my next post.
As I mentioned last week, this week is one of the most historically bearish weeks of the year on SPX, and in a few days we will be starting the most bearish four months of the year on NDX. If we are going to see the decent retracement that is setting up here, this is the ideal time to do that. We’ll see how that goes.
Last Friday’s commodity webinar was delayed until Thursday 24th June, so we will now be doing a double bill of free public webinars at theartofchart.net on Thursday starting an hour after the close.
Those two webinars will be firstly the monthly Big Five and Key Sectors webinar covering AAPL, AMZN, FB, GOOG, NFLX, TSLA and eleven sector ETFs. If you’d like to attend you can register for that here. The second webinar, starting half an hour after the first, is the commodity trading webinar. As usual we will be looking at three promising trade setups and designing three options setups to trade those. You can register for that here, and the registration links and recordings for that and the other free webinars this month are also of course on our June Free Webinars page.
We also run an annual July 4th sale at theartofchart.net with an additional 20% off the already discounted price for annual memberships, giving effectively four free months on an annual membership until the sale ends. If you’re interested the sale page is here, and remember you need to enter the sale code JULY4SALE in the checkout process.
Assuming that the rest of the week is interesting, I’m planning at least one more post.
 22nd Jun 2021