I’ve been distracted this week by a divorce hearing yesterday morning, but that’s out of the way now and I’m doing two posts today. This first one is talking about short term upside targets across SPX, NDX, IWM and INDU and the second one later today will be looking at the bigger picture case for a backtest of the 3750-3800 SPX area soon, and the potentially very bullish implications if we were to see that happen.
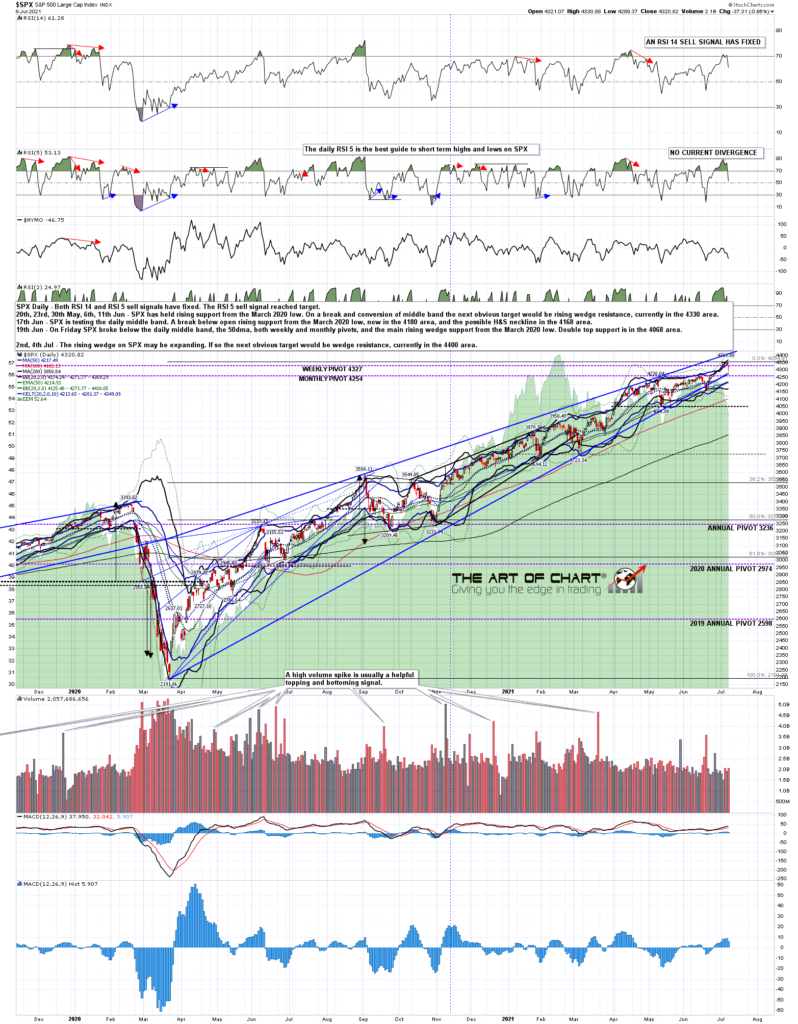
For now on SPX the wedge resistance trendline is in the 4400-10 area, and the retracement over the last couple of days could set up a very decent possible RSI 5 sell signal if SPX heads directly to that target from here.
SPX daily chart:
NDX and the Big 5 are looking worryingly toppy here and may be peaking short term, but on a move higher I have a very attractive resistance trendline currently in the 15,250 area.
NDX weekly chart:

On IWM there have been two near miss attempts at a retest of the March high and that may still be unfinished business above. The price action from the early June high may be forming a bull flag.
IWM 60min chart:
On Dow a decent bull flag has formed from the May all time high and broken up. That should deliver a retest of the all time high and I’ll be looking for that if we see the 4400 test on SPX.
INDU 60min chart:
ES has broken back over the weekly pivot at 4318 overnight, and Fridays have been pretty bullish lately, so we’ll see whether the bulls can get SPX and closer to that upside target today.
We are holding our monthly public free Chart on Sunday at 4pm EDT. If you’d like to attend then you can register for that here, or on our July Free Webinars page.
We run an annual July 4th sale at theartofchart.net with an additional 20% off the already discounted price for annual memberships, giving effectively four free months on an annual membership until the sale ends in couple of days. If you’re interested the sale page is here, and remember you need to enter the sale code JULY4SALE in the checkout process.
Everyone have a great weekend.
 09th Jul 2021