The mean reversion move that I was looking for in my posts over the last two weeks has now completed, with SPX breaking below the 45dma, now at 4562. That is the main target for the move hit, though that doesn’t mean that the low is necessarily in, or close. There are some signs that a low may be forming here, but as yet not enough of those to suggest that this retracement is likely to be in yet.
SPX daily vs 45dma chart:
On the SPX daily chart the decline is a daily lower band ride and main resistance is the daily middle band, now in the 4660 area. Important short term support is at the 3sd lower band, now in the 4469 area with closes close to the 3sd lower band on both Tuesday and Wednesday. If hit, a close much below it would be rare, so any hit is likely a decent short term long opportunity.
How long can a daily band ride last? Well these can last a while actually, so I’m going to review the important levels and targets below.
SPX daily chart:

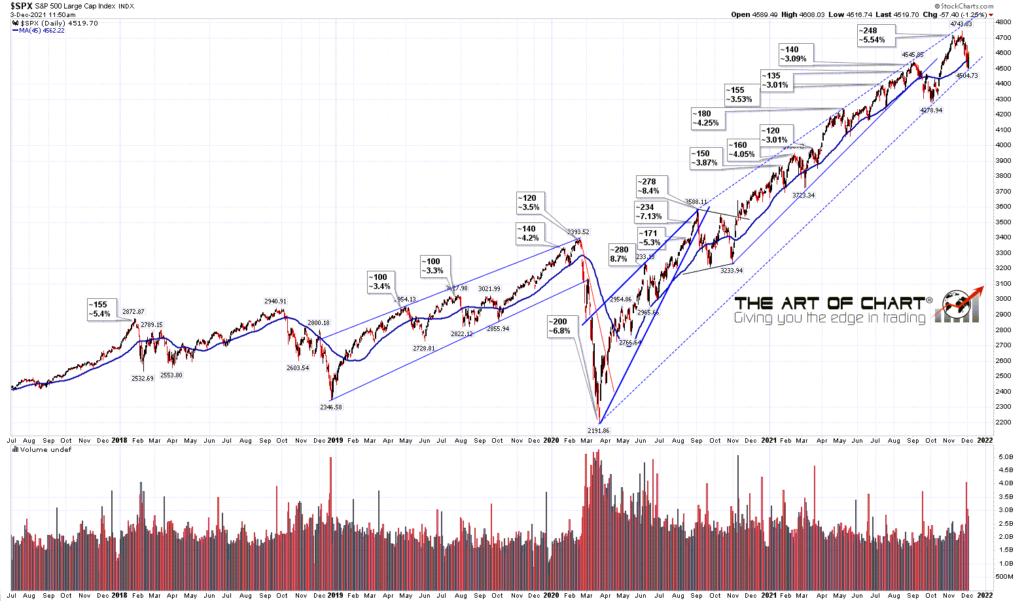
SPX made both the alternate double top targets I gave at 4540 and 4515, so the next and very important support level is rising support from the March 2020 low. On my daily charts it looks as though that has been hit but on the hourly chart below you can see that isn’t yet the case, and I have that in the 4480-5 area. There is now a strong chance that will be tested.
If that support is broken, then there are no further targets below, but there is a possible H&S neckline and established support level at the October low at 4278 that might then be a possible target, particularly as Nasdaq has stopped trailing on the way down and has now been the weakest of the main US indices since the lows yesterday morning.
The daily RSI 14 sell signal has not yet made target but I would note the possible RSI 5 buy signal that is now brewing, which is one indicator suggesting that a retracement low on SPX may be close.
SPX 60min chart:
On NDX the daily RSI 14 sell signal is also not close to target yet, and the rising support trendline from the March 2020 low is now in the 15200 area. That is also of course the target on the H&S that I’ve been looking at on NDX since last week and which broke down early this week. With NDX now fully on board with this retracement that target is now looking more likely to be hit.
NDX daily chart:
This is the H&S on NDX shown on the 15min chart. That has now made it more than halfway to the target at today’s low, and the high quality support trendline shown on this chart that I was thinking might hold broke on the decline this morning. The corresponding high quality support trendline on NQ also broke, so that has cleared the main obstacle that might have prevented this target on NDX being hit. I would put the odds of hitting it now at over 50%. We’ll see.
NDX 15min chart:
Could a larger high be forming here? Yes, and I’d refer back again to the backtest scenario that I was looking at in my post on Friday 6th August. This could be setting up for that backtest here and I’m watching for a possible larger topping pattern to form that could deliver that target.
We our running our monthly public Chart Chat at theartofchart.net at 4pm EST on Sunday and obviously that’s likely to be pretty interesting this month. If you’d like to attend you can register for that here. or on our December Free Webinars page. We look at the setup on equity indices there as well as the usual very wide range of other instruments. Particularly interesting looking setups on bonds, USD and silver if you are taking a look.
I’ve mentioned before that I’m developing a new daytrading room with my long term daytrading collaborator Paul Buckles. That’s in late beta at the moment and I’m looking for a few more of my longer term readers who daytrade to come and join us while we are making this ready for market. Obviously there would be no charge and we will be explaining our methods, which are mainly mathematical, as we do this. For any who then want to join when we launch the room there will be a reward in the form of a special discount for them. If you’re interested email me on springheeljack666 at gmail dot com.
 03rd Dec 2021