Everything is in the groove from my post yesterday. NDX and ESTX50 made new all time highs yesterday. SPX and Dow made new all time highs today, RUT retested the August high today, making the second high of a possible double top. Only DAX looks slightly short of a new all time high but that may well be made too on Monday.
I had a look at all of these in my premarket video at theartofchart.net this morning and posted that on my twitter. If you missed that and would like to see it, you can see that here.
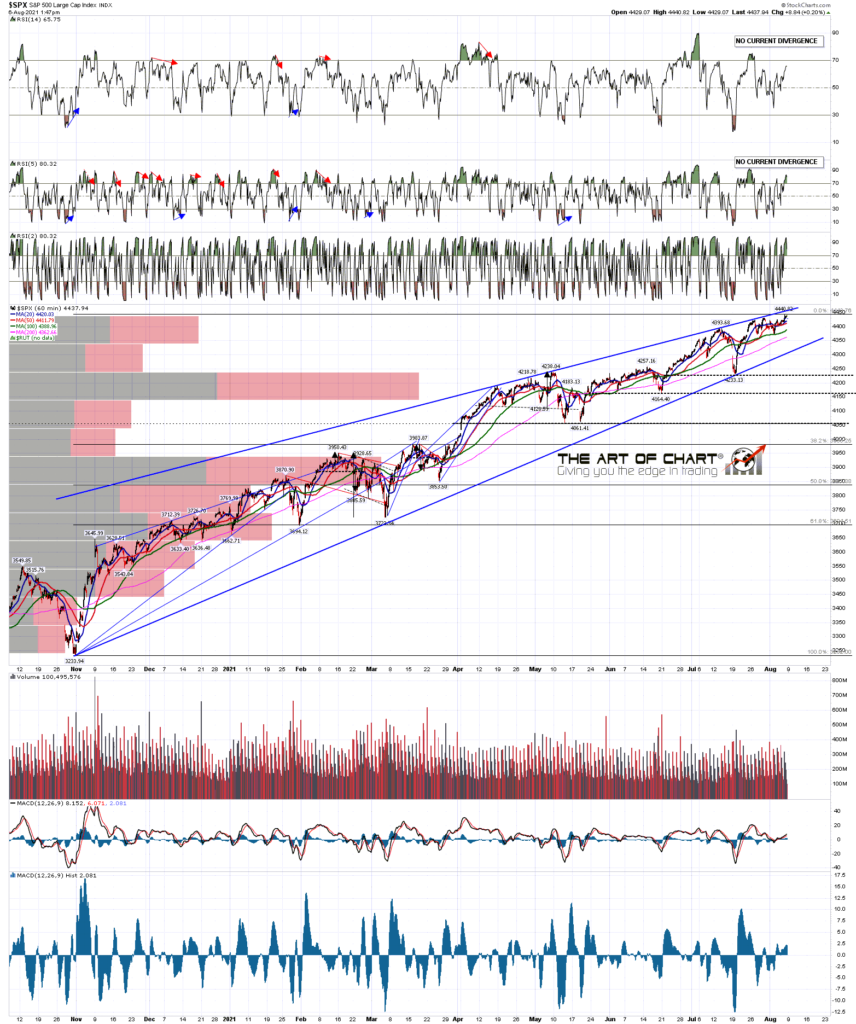
Obviously there is a chance that everything breaks up further here, so I’m carefully watching the well established resistance trendlines on SPX and NDX. The SPX wedge resistance trendline is currently in the 4450-5 area.
SPX 60min chart:
The NDX resistance trendline is currently in the 15300 area.
NDX 60min chart:
The chances of seeing a short term high are pretty decent, and we should see a retracement after that. If that retracement is deeper than the fairly shallow retracements that we have been seeing so far this year, then we have a decent historically bear friendly time window into October to see that.
There are some possible topping setups here that could deliver a backtest of the 4000 area on SPX, but the level I’d really love to see backtested is the 3800 area, and the main purpose of this post is to explain why that area would be so significant if we were to see a backtest there, and to look at the setups in the event that it held, or if it broke.
To do that I’d like to show a couple of past patterns that are in my mind, and to show how they might be instructive here.
The chart below is the SPX weekly chart 1980-8, and shows the bull move into the 1987 crash and just afterwards. I’ve seen a few people over the years say that move was an entirely unpredictable black swan, but on the chart below I show how the whole move was a model of technical precision, and that the 1987 crash delivered a very decent Fibonacci retracement of that move, though for sure a lot faster than anyone might have expected.
In particular I would draw your attention to the rising wedge that formed 1980-5, that broke up in 1985 with a target in the 295 area, backtested broken resistance perfectly, and then made that target in early 1987.
Rising wedges and megaphones normally break down of course, but I have seen a drawn a lot of these over the years, and the wedge or megaphone break with the clearest targets and highest probability of making target are the ones that break up. They do however need to confirm the target with the way they break up, which is to break up from the pattern, often but not always with a bullish underthrow of pattern support first, then deliver a decent and precise backtest of the broken resistance trendline, and then make a higher high with confidence to confirm the target.
SPX weekly 1980-8 chart:
Here is another example from June 2013 that some of my longer term readers may recall me first posting on 17th June 2013. At the stage I posted this the wedge had broken up with a target in the 1955 area, and done the perfect backtest. I followed this through the higher high and into the target reached in 2014.
SPX daily chart from 17th June 2013:

So …. why is this relevant here?
Well the move up from the 2009 low on SPX formed a really nice rising megaphone. That broke down in 2020 and when SPX made a higher high from there my first thought was that it was expanding into a larger megaphone. If that had been the case then obviously the old resistance would have held, as it did for three months before breaking up in November 2020. After that I was thinking the break up might be a bearish overthrow, but while that is still technically possible, SPX has broken up too far since for that to be likely.
Now it may be that the move into the March 2020 low broke that pattern, delivered a fibonacci retracement and that we are in a new sequence, but the other possibility is that the rising megaphone from the 2009 low has broken up with a target in the 6560 area.
If so though, then next and necessary step in the sequence would be a backtest of the broken megaphone resistance, currently in the 3750-3800 area. That would need to hold, and then I would be looking for a higher high over this one with confidence to confirm the then high probability target in the 6560 area.
SPX monthly chart:

Now I know some will be thinking that is a ridiculous idea, but given the worldwide economic blows taken over the last eighteen months from COVID, I think equity indices have already moved through ridiculous. The current nosebleed index levels have been reached on tidal wave of quantitative easing and stimulus spending and, at the moment, that shows no obvious sign of stopping and may even, in terms of stimulus spending, be increasing further. How far can this move go? Well as I said, the obvious resistance was in the 3600 area last year. From here I can see no reason to think SPX can’t go considerably higher as long as the Fed and government are supporting it. As always, we’ll see.
Our monthly free Chart Chat at theartofchart.net is being held on Sunday. If you’d like to attend you can register for that here, or on our August Free Webinars page.
 06th Aug 2021
Pingback: Still Testing Strong Resistance – The Art Of Chart
Pingback: Possible Topping Action Here – The Art Of Chart
Pingback: Testing SPX Rising Wedge Resistance Again – The Art Of Chart
Pingback: Nasdaq Setting Direction Here – The Art Of Chart
Pingback: Mean Retracement Looks Close – The Art Of Chart
Pingback: Options For Next High – The Art Of Chart
Pingback: Thanksgiving Thoughts – The Art Of Chart
Pingback: The Daily Lower Band Ride – The Art Of Chart
Pingback: Choices Choices – The Art Of Chart
Pingback: Taking Stock – The Art Of Chart
Pingback: Back In the USSR – The Art Of Chart
Pingback: Oversold Bounce – The Art Of Chart
Pingback: Decent Looking Candidate Low – The Art Of Chart
Pingback: Back On The Three Day Rule Again – The Art Of Chart