After the low last week very decent quality IHS patterns formed on SPX, NDX, IWM and Dow and broke up this week. They all failed, setting up targets at the retest of last week’s lows, which would generally all be reached, so the fact that only Dow has delivered that retest so far tells us that there may well be unfinished business below.
The question here is whether the impressive collection of bull flags that have formed from the all time highs on many indices and stocks are going to deliver, and equities are still in the inflection point where that decision is being made.
There are better quality bull flags formed elsewhere, but the one shown on SPX below is pretty decent.
SPX 60min chart:
I was thinking that we might see a retest of the low and daily lower band together yesterday but both were missed. What next? Well the lows were almost retested on both SPX and NDX yesterday, and so there are decent quality potential double bottoms now in play on SPX, NDX and Dow, but the marginal higher low increases the odds that SPX and NDX may be forming bear flags or (likely bear) triangles that would then deliver retracement low retests in the next few days. If so the next move on SPX may well be a higher high over the rally high this week at 4090.72 so, if seen, a break over that would deliver an inflection point where SPX could either head to the double bottom target in the 4310-20 area, or fail back into the bear flag target at a retest of the retracement low.
SPX daily BBs chart:

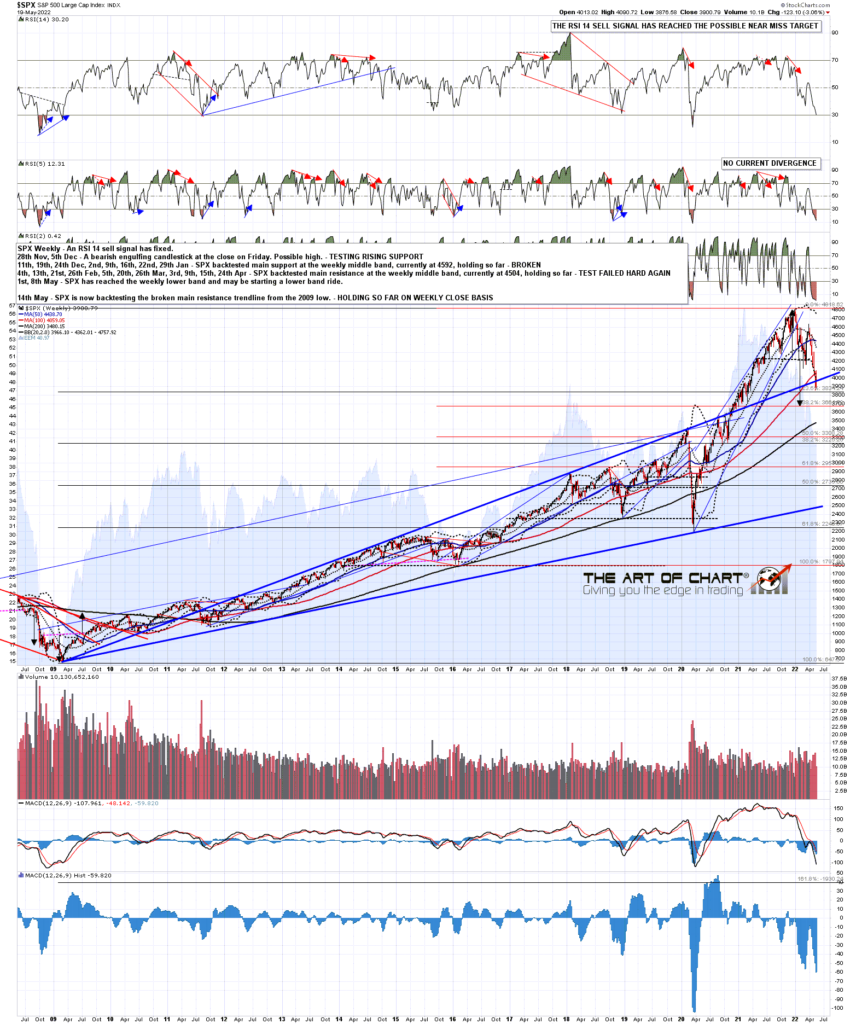
The question for today is whether SPX is going to close above or below the main SPX support trendline, currently in the 3970 area. It isn’t a really strong indicator for the bears if that is broken today, but I would note that since the start of the trendline at the 2009 low, this trendline has only broken twice on a weekly or monthly basis, and both times followed through hard on that break. Now two instances isn’t a statistically significant sample, but it would still be better for the bull flag scenario if that trendline holds at the close today.
SPX weekly chart:
Two sector ETFs caught my eye after the highs this week, because they both perfectly held their short term resistance trendlines at those highs. A break above those now would therefore look potentially bullish.
XLF doesn’t have an obvious overall bull flag though and definitely has a lot of further downside potential.
XLF 60min chart:

There is a decent quality bull flag setup on XLI though, and the double top target from the high made target last week. A break over the resistance trendline would open the nice looking double bottom setup here, and a very possible move back to flag resistance, currently in the 103.60 area.
XLI 60min chart:

Fridays generally lean bullish, so I’ll be watching my main SPX support and resistance trendline today. If SPX recovers over 4000, there are decent odds that 4100 will be coming next to set up the next obvious inflection point.
That said, today is May expiration, and the historical stats lean bearish, with about 38% green closes on SPX. If SPX heads down I’ll be watching particularly for the full low retests on SPX and NDX, and ideally there would then be a strong rally back over the weekly SPX trendline by the close. That would be a strong bullish setup into next week, which leans modestly bullish every day.
Everyone have a great weekend 🙂
 20th May 2022