In my last post a week ago I was talking about the prospects on SPX for testing the weekly middle band, currently at 4312, on this rally, with particular reference to the very historically bullish two first days of June, which were the last two days. Unfortunately for the bulls, these were both wasted in a sideways consolidation, so reaching that target now looks more doubtful, and the odds of a break down before that target is reached have increased.
On the daily chart the middle band, currently at 4024, is now key short term support, and above that is the new monthly pivot at 4083, tested and confirmed as support in the last two days. If SPX breaks and converts those to resistance, then this rally would likely be over and I’d expect a retest of the retracement low at 3810.32 not long afterwards. A possible daily RSI 5 sell signal is brewing and I wouldn’t be surprised to see SPX fail directly from here.
SPX daily chart:

In the short term SPX retested the rally high in the last hour yesterday, and that has set up a possible double top setup that could play out next. Short term trendline support is now in the 4110 area, and there is still a decent looking double bottom that has broken up with a minimum target in the 4325 area, slightly over the larger possible IHS neckline in the 4307/8 area.
SPX 15min chart:

On NDX there is still a decent looking double bottom target in the 13500 area, slightly under the possible IHS neckline in the 13550 area. As with the SPX double bottom target that can still be reached, but the best time to have done that would have been in the last two days, so that is less likely now.
As with SPX, in the event that NDX breaks the support established this week, then there is a decent looking double top setup that could take SPX much of the way back to the lows.
NDX 15min chart:
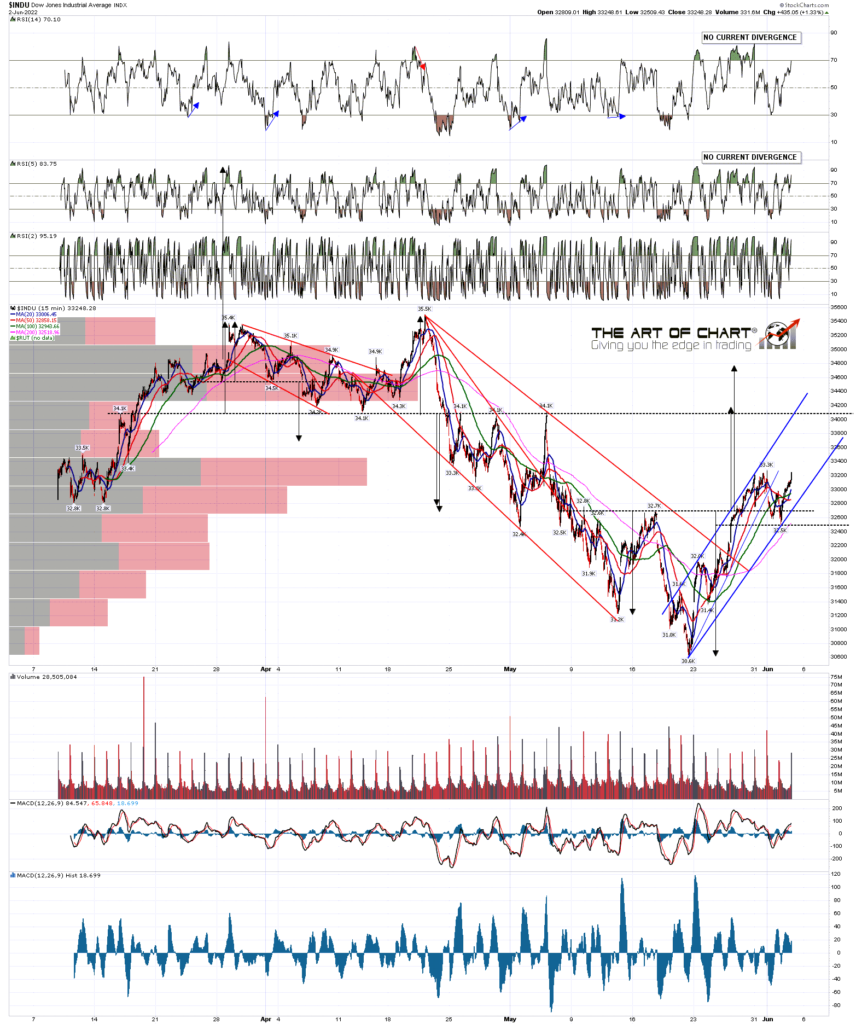
On Dow there is still a decent looking double bottom target in the 34,200 area, slightly under the possible IHS neckline and very well established resistance in the 34,100 area. As with the SPX and NDX double bottom targets, that can still be reached, but the best time to have done that would have been in the last two days, so that is less likely now.
As with SPX and NDX, in the event that INDU breaks the support established this week, then there is a decent looking double top setup that could take INDU much of the way back to the lows.
INDU 15min chart:
On IWM there is no current bottoming pattern target, but the possible IHS neckline is in the 194 area. As with SPX, NDX and Dow, there is now a possible double top setup that could take IWM down again, and unlike any of the others, the obvious read on IWM since the low on 11th May is that a large bear flag has been forming.
IWM 15min chart:

There is still a choice to make here, and the odds of making the ideal double bottom targets and resistance levels have reduced because the ideal time to do that was in the last two days. There are decent short term topping patterns and in the event that SPX trades sideways again today the odds of a hard fail near the start of next week would be high.
One way or another SPX is likely to retest the current retracement low, because a move like the one we have seen so far this year will generally finish with a strong move down on high volume, and we haven’t seen that yet. The odds are decent that the move down to test the low will start over the next few days, and a potential setup is already in place for that to start today.
The historical stats over the next week are neutral today and Monday, lean bullish on Wednesday, and bearish on Tuesday, Thursday and Friday. If we don’t see SPX test the 4300 target area by Wednesday at the latest, then the odds will be good that this rally will fail without reaching it. If so there should by then be stronger rally pattern setups from the lows on the US indices and I’ll be posting those.
We did our monthly free webinar at theartofchart.net on Big Five stocks and (eleven) Key Sectors yesterday, and if you’d like to see that the recording is posted here.
We are doing our monthly free Chart Chat at 4pm Eastern Time on Sunday, covering equity indices, bonds, commodities and so on, and if you’d like to attend you can register for that here, or on our June Free Webinars page.
Everyone have a great weekend 🙂
 03rd Jun 2022