I hope everyone had a great Independence Day weekend. For some obscure historical reason that isn’t a public holiday over here in the UK, but as I work US hours I had a very pleasant long weekend.
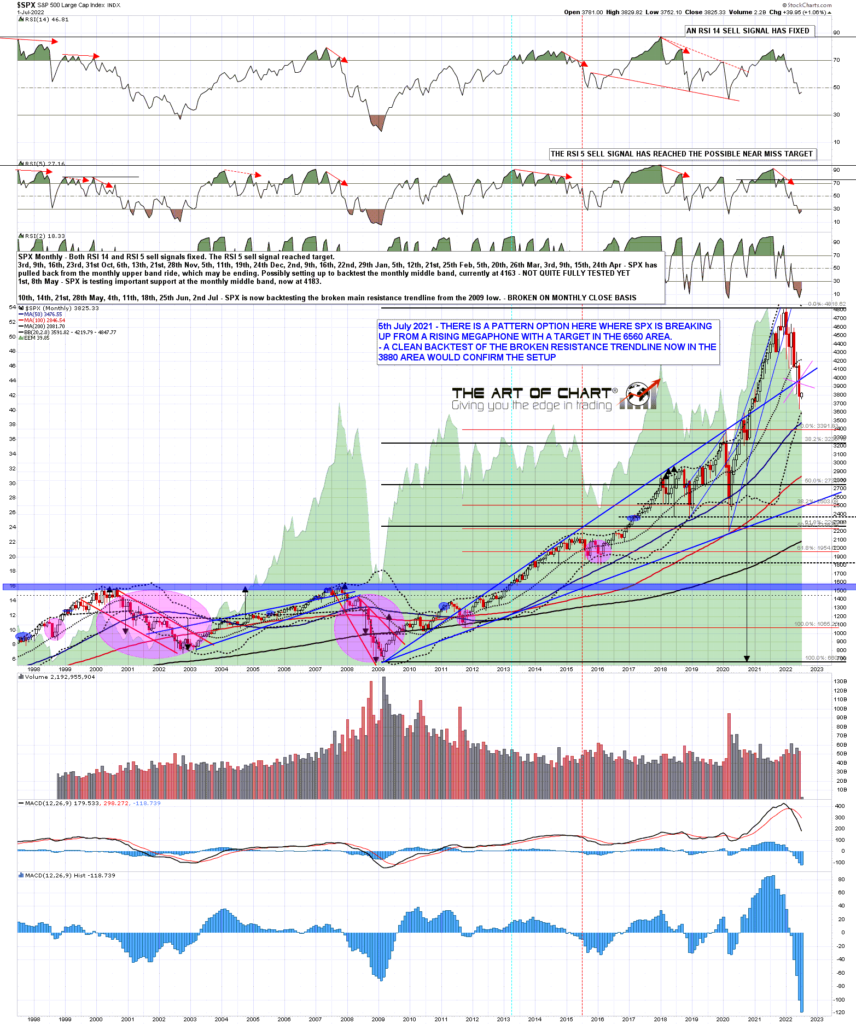
I’m going to look at the short and longer term prospects for SPX here, and I’ll start with an important longer term chart, the SPX monthly chart where there has now been a monthly close below the key support & resistance trendline on SPX since the 2009 low.
That opens the possibility for further downside and we may well be seeing that either sooner or later.
SPX monthly chart:
In the shorter term though, there are high quality bull flag setups on the US indices I follow, on SPX, NDX & Dow Industrials. On foreign indices there are others on Nikkei and DAX, and the DAX flag appears to have already broken up. This doesn’t mean that we are going to see across the board all time highs retested on these (excluding Nikkei where that is still the 1990 high), but it remains a significant possibility from this pattern setup.
If we are going to see that then a retest of the current 2022 low would improve the short term bottoming setup and I’m thinking we may see that retest today or tomorrow, with the historical stats leaning significantly bearish today.
Main short term resistance on SPX is at the daily middle band, now at 3871, and that would need to be broken and converted to open the upside and a possible test of main downtrend resistance at the weekly middle band currently at 4186. A break and conversion of that would open the path to a possible retest of the all time high.
SPX daily chart:
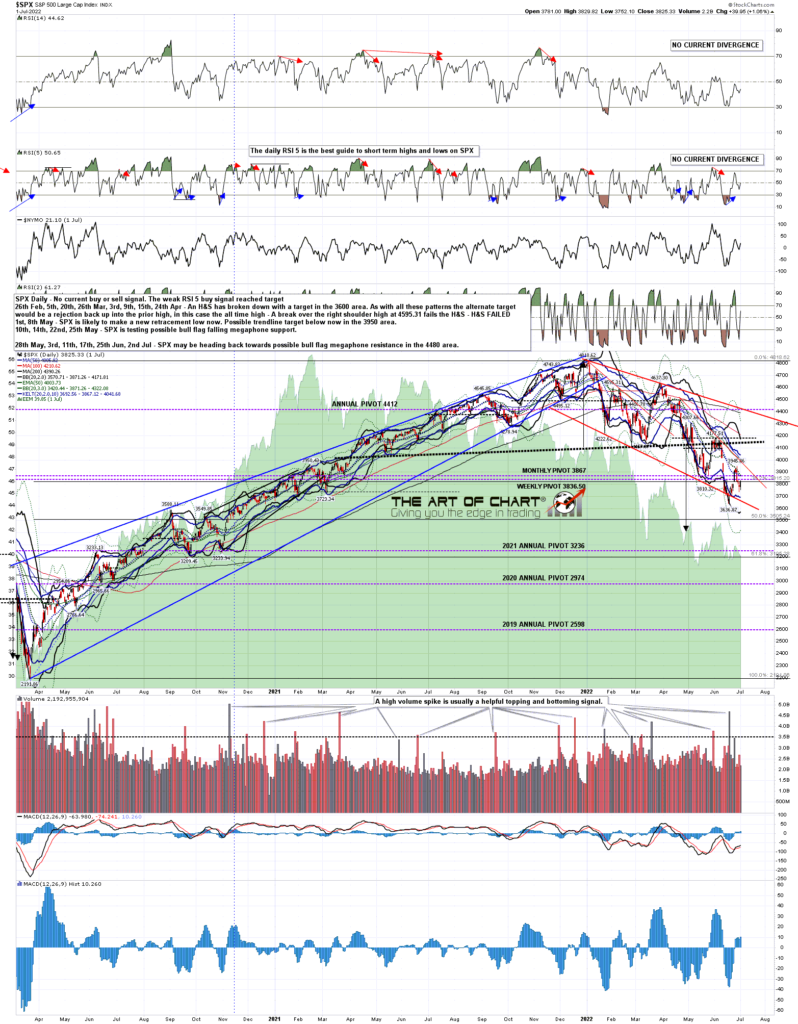
The other short term resistance that I am watching here on SPX is the 5dma, currently at 3830, and that was resistance on Friday. A daily close back above that would put SPX back on the Three Day Rule, and if we were to see that today, then a break back below it on either of the next two closes would set up a possible retracement low retest.
SPX daily 5dma chart:

On NDX, as with SPX, the bull flag setup is a high quality falling megaphone, and NDX is now between the 50% and 61.8% retracement levels for the move up from the 2020 low. A move much below the 61.8% fib retracement level in the 10590 area would weaken the bull flag setup.
NDX daily chart:
There is another high quality bull flag falling megaphone on Dow, and all three have solid positive divergence on the weekly charts, with a weekly RSI 5 buy signal already fixed on NDX.
INDU daily chart:

There is an opportunity to retest the 2022 low today or tomorrow as while the bullish stats on Friday delivered, there was no significant break to the upside. The stats for today lean significantly bearish, and after that the stats lean bullish until July opex on Friday July 15th, which again leans significantly bearish. The significantly bullish leaning days in the meantime are tomorrow, and Wednesday and Thursday next week.
If we do see a retest I would love to see the second low of a modest size double bottom be established there but I would add that if we are going to see a hard break down to start trashing the lovely bullish setup that has formed from the highs, then that would be an ideal time to start that too. We shall see.
We hold a couple of sales on annual memberships every year at theartofchart.net, and the summer sale is now drawing to a close in the next couple of days, with an extra 20% off annual memberships, so eight months for the price of twelve. If you’re interested the sale page is here, the sale code is july4sale, and the sale is probably ending on Wednesday 6th July.
I should mention again that our Follow The Leader service at theartofchart.net is up 100% so far this year. The technology to support this service is provided by our partner, GFF Brokers. GFF Brokers is an authorized broker for the World Cup Trading Championships Advisor programs. The profits on that so far this year on the nominal account of size at $25k would be enough to pay the Triple Play subscription at the standard monthly price for ten years. Follow The Leader is included in the Daily Video Service and the Triple Play Service, which includes the Daily Video Service. If you’d like to try a free trial of the Triple Play service you can find that here.
 05th Jul 2022