Last weekend I was looking at the higher probability bear flag formation options on SPX and was looking at the resistance trendline on the chart below as the highest quality bear flag resistance trendline. That’s in the 4050 area now, having eliminating the triangle option in the move up this week, and SPX successfully negotiated the very bearish historical stats yesterday to reach the 4000 area this morning.
SPX 15min chart:

On the bigger picture SPX is currently on a daily upper band ride and the 3sd upper band is in the 4050 area today, so that trendline could be hit today but SPX shouldn’t really go higher.
SPX daily BBs chart:

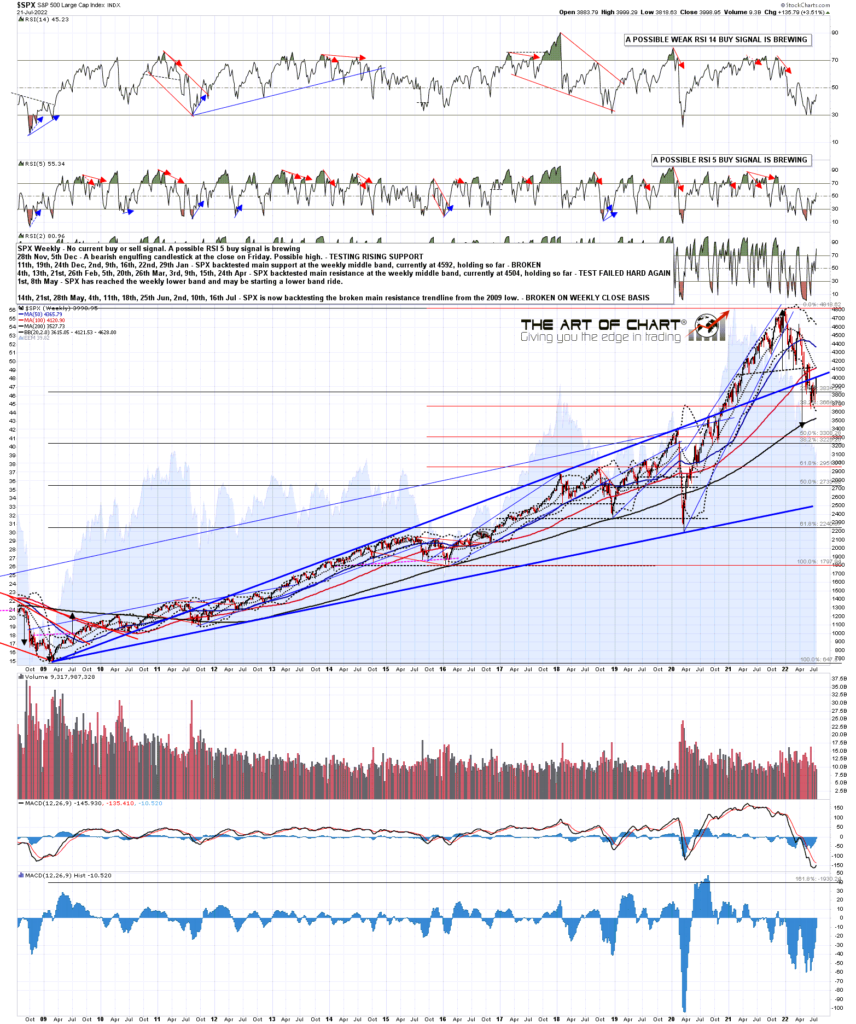
I’ve mentioned a few times that possible weekly buy signals are brewing on SPX on both RSI 14 and RSI 5 and if today holds at least the level of yesterday’s close today then they should both fix at the close. That would be a significant technical strike in favor of an overall bottom forming here for the move this year.
SPX weekly chart:
In the shorter term there is now a lot of negative divergence on the hourly charts on the US equity indices which had me thinking that we might see a retracement start yesterday. We could equally start such a retracement today. There are possible RSI 14 and RSI 5 sell signals forming on the hourly chart.
SPX 60min chart:
On NDX, which has been leading this rally in my view, there is similar hourly negative divergence but the obvious trendline target is higher, and a decent match with the possible IHS neckline in the 12900 area.
NDX 60min chart:
The historical stats for today are neutral, neutral to bullish on Monday, and neutral for the rest of the week apart from Wednesday, which is 61.9% bearish. August then leans fairly neutral throughout until the end of the month.
If you’re wondering where I get these daily historical stats from, I get those from the Stock Trader’s Almanac 2022 by Jeffrey A Hirsch. I’ve been getting one at the start of every year for many years now and they are available from Amazon in the US and elsewhere.
We did our monthly free Big 5 & Key Sector ETFs webinar an hour after the close on Thursday. If you missed that you can see the recording here, or on our July Free Webinars page.
Everyone have a great weekend. 🙂
 22nd Jul 2022