In my last post I was talking about the possibility of a triangle forming on SPX. That triangle arguably then finished wave D at the low that day and then broke down the next. Had that been a bear flag triangle then the target would then have been a retest of the 2022 low, but it seems likely from the action since then that if there is a bear flag forming here short term, which seems likely, then it is still forming.
I’ve drawn in some trendline options on the SPX chart below for a possible larger bear flag triangle or rising megaphone. The megaphone resistance trendline in the 4025 area is the highest obvious option.
SPX 15min chart:
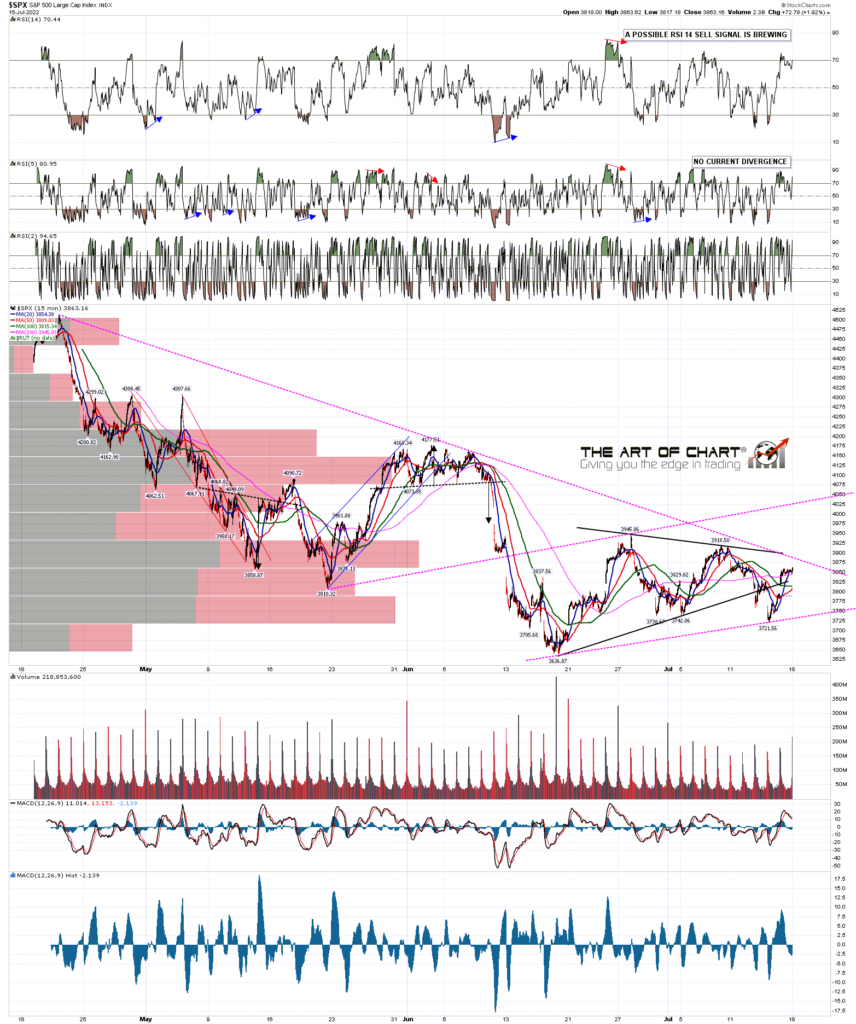
On Wednesday there was a clear break below the daily middle band, currently at 3816, with the break confirmed on Thursday and a break back above on Friday. That opens higher targets, though if we were now to see a rejection candle with a clear close back below the daily middle band on Monday, then that would be a very bearish looking candle that might well deliver a retest of the 2022 low at 3636.87 directly from there.
SPX daily BBs chart:

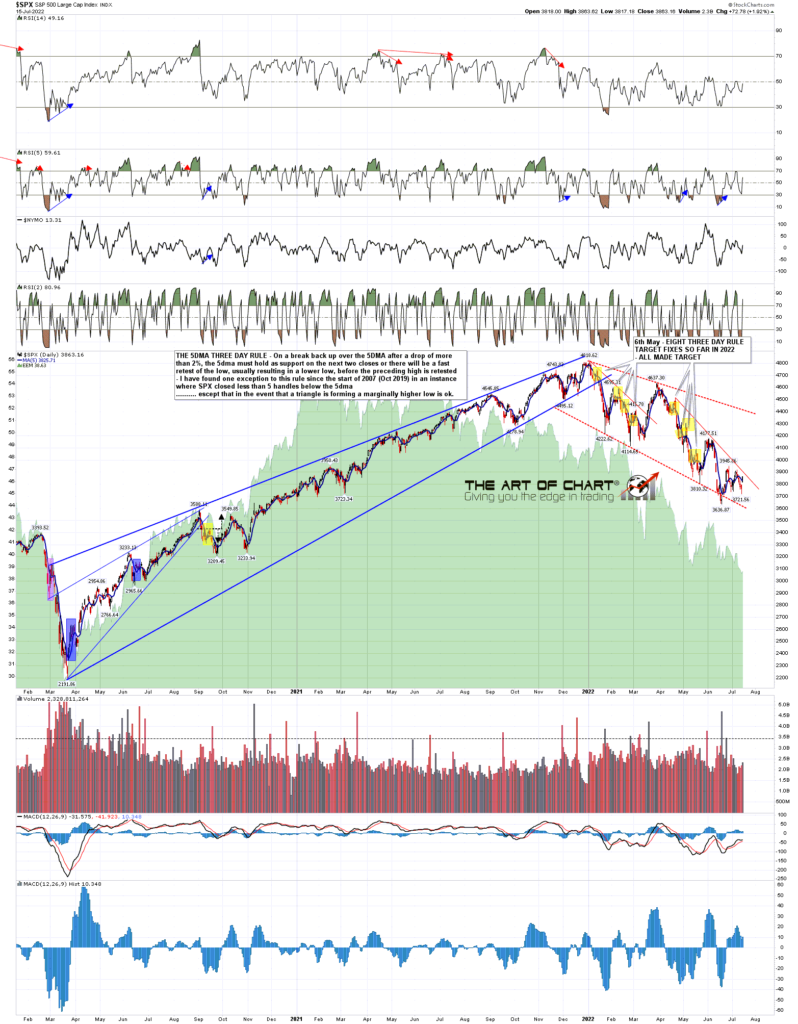
On the SPX 5dma chart there was a break back above the 5dma on Friday, after a prior decline of more than 2%, so SPX is back on the Three Day Rule. A clear close back below the 5dma, currently at 3825, on Monday or Tuesday would look for a retest of last week’s low at 3721.56, and that option too would likely lead directly to a retest of the 2022 low.
SPX daily 5dma chart:
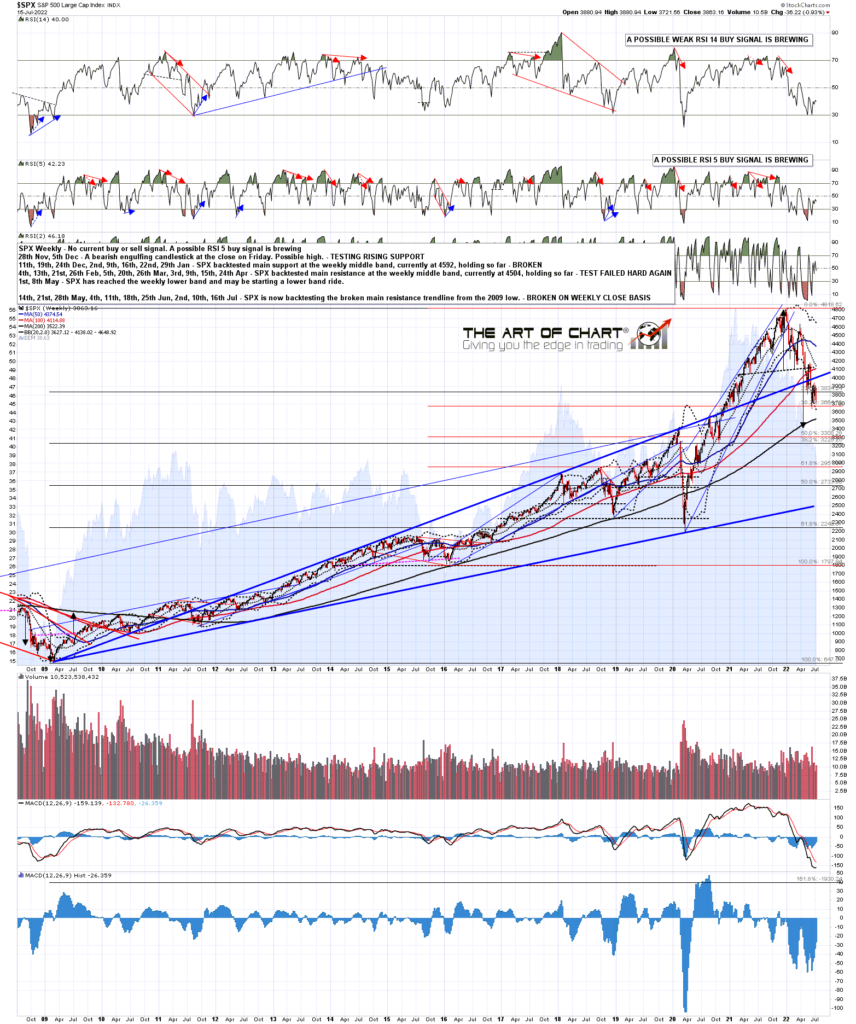
I’m not seeing any obvious options or trendlines here that might deliver a test of main downtrend resistance at the weekly middle band, currently in the 4138 area, so I’m expecting that this rally will likely fail before then into the low retest. At that low retest I’m expecting either (preferred option) to make a double bottom to finally see if all these big bull flag setups on equity indices might deliver anything, or continue downwards to most likely break the flag setups. We’ll see.
SPX weekly chart:
In the short term one important level that I’m watching here is the 50dma on NDX, currently at 12051. That was strong resistance at the rally high so far, and if it still is, with NDX closing at 11983 on Friday, any move up from here would be very limited, favoring the rejection option on SPX on Monday.
NDX daily chart:
The historical stats for the coming week are neutral Monday and Friday, leaning bullish on Tuesday, leaning strongly bullish on Wednesday (76.2% green closes) and strongly bearish on Thursday (81% red closes). The week as a whole is prone to wild swings of 3% to 4% in either direction.
If you’re wondering where I get these daily historical stats from, I get those from the Stock Trader’s Almanac 2022 by Jeffrey A Hirsch. I’ve been getting one at the start of every year for many years now and they are available from Amazon in the US and elsewhere.
We are doing our monthly free Big 5 & Key Sector ETFs webinar an hour after the close on Thursday. If you’d like to attend you can register for here, or on our July Free Webinars page.
 17th Jul 2022
Nice post Jack!