If you missed our free public Chart Chat at theartofchart.net on Sunday then you can see the recording here or on our monthly free webinars page here.
In that Chart Chat we were saying that a retest of the rally high was likely early this week, and we saw that yesterday. SPX has a daily RSI 5 sell signal brewing, a fixed hourly RSI 14 sell signal, and the trendline setup for a reversal here looks very nice indeed. The next step if we are going to see a reversal here would be a break of the short term rising support trendline now in the 4105 area, and ideally the formation of an H&S at the possible neckline in the 4080 area.
SPX 15min chart:

On NDX the overall bear flag setup from the low is less compelling, but the short term rising wedge has broken down and a small double top has formed. On a further break down I would be watching for a possible H&S to form at the potential H&S neckline in the 12815 area.
NDX 15min chart:
I did mention last week that I was watching the declining resistance trendline on NDX and that has been tested and is holding so far. If that continues to hold and a retracement starts here that does raise the possibility that if the 2022 low is retested, then NDX might continue down to falling megaphone support, currently in the 10,200 area. If seen that would significantly weaken the overall bull flag setup as the retracement would then be below the 61.8% fib.
NDX 60min chart:
I was saying last week that I’d like to see Dow retest the 33.0k area and we saw that yesterday. As with SPX Dow is now in the ideal resistance area, a possible daily RSI 5 sell signal is now brewing, and the bear flag pattern setup from the 2022 low looks very nice indeed.
INDU 15min chart:

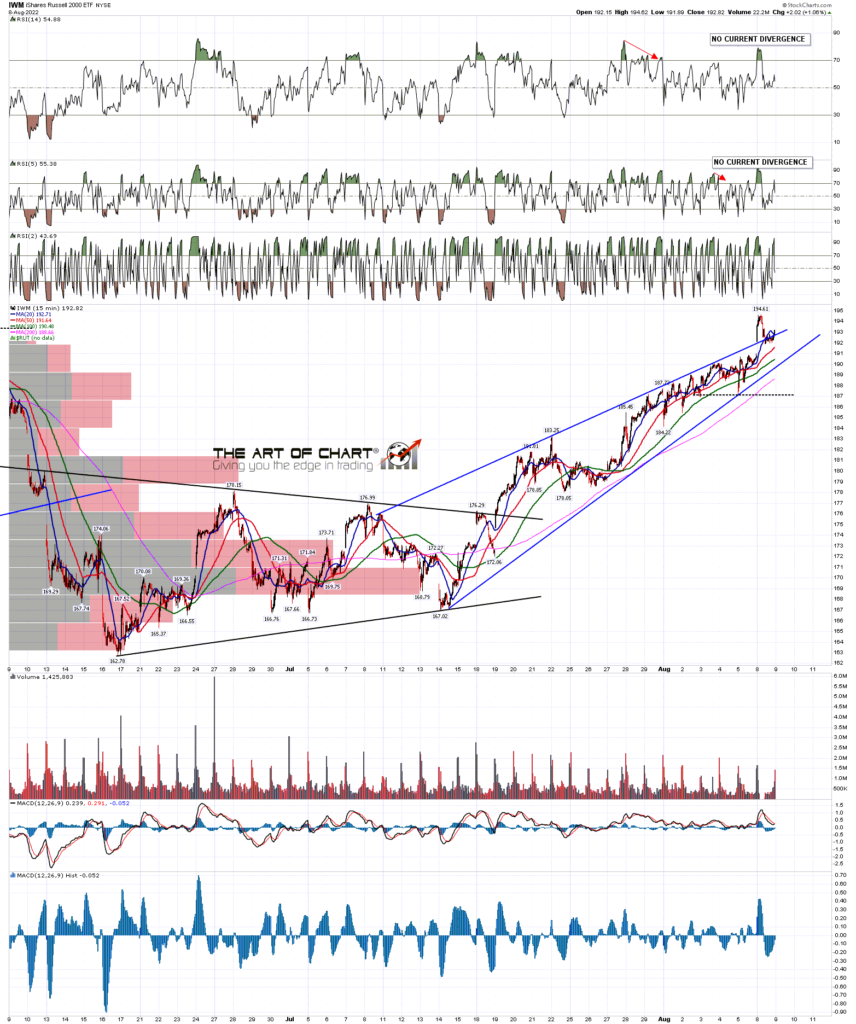
IWM is a jarring note here, with a break over the ideal resistance area and the short term rising wedge resistance trendline. This might be just a bearish overthrow but I’d like to see that turn down directly from here really.
IWM 15min chart:
The obvious inflection point has set up here at the obvious resistance area. Do the equity indices have to turn down here? No, as that isn’t the way things work in this universe, but the prospects for at least a significant retracement from this area look good. We’ll see how that goes.
In terms of the historical stats they lean neutral to bearish for the rest of this week apart from tomorrow, which leans 61.9% bearish on SPX. If we are going to see a reversal here then that would ideally happen this week, and deliver a weekly close back below the SPX weekly middle band, now in the 4080 area. That would deliver a weekly rejection candle to reverse last week’s closing break over the weekly middle band.
If we don’t see a reversal start this week then I’d note that the first three days of next week all lean significantly bullish, at 61.9% bullish on Monday and Tuesday and 71.4% bullish on Wednesday.
If you’re wondering where I get these daily historical stats from, I get those from the Stock Trader’s Almanac 2022 by Jeffrey A Hirsch. I’ve been getting one at the start of every year for many years now and they are available from Amazon in the US and elsewhere.
My next post will likely be on Friday before the open.
 09th Aug 2022