Apologies for this being the only post this week. I’m moving house in a few weeks and I’ve been really busy.
In my last post I was looking at the possible hard fail setup on SPX, NDX, IWM and Dow if the inverted H&S patterns that had broken up failed on moves back below the right shoulder lows on those patterns. On that fail there would be targets back at the retests of the 2022 lows and the last of those four low retest targets were hit at the low yesterday.
SPX tested the 200 week moving average for the third time this week and did an impressive pinocchio below it yesterday morning, though SPX recovered back over it quickly. For what it’s worth that was the largest pinocchio down through it since the low in 2009, excluding of course the hard break below it in 2020.
If the economic outlook wasn’t so dire I’d be looking for a possible serious low here, and I’m still keeping that in mind as a possibility, but the more likely outcome is that this rally here plays out and the 200 week moving average, now at 3600, continues to be tested until it breaks in earnest and converts to resistance.
SPX weekly chart:

It is a rare thing for an SPX daily RSI 5 buy signal not to at least make the possible near miss target in the 65-69 area on the daily RSI 5, and this one hasn’t. I think there is a decent chance that it will make that target on this rally, though it might fail too soon, and I have two main initial target areas, the first of which is being tested as I write this. A test of the next resistance area in the 3810 might well get that buy signal to target.
SPX daily chart:

The last rally high was at the daily middle band on SPX, and the low yesterday hit the daily lower band. The first obvious target and serious resistance is back at the daily middle band, now at 3710, and that is being tested today. The rally may well fail there, either directly at resistance, or with a closing break above today that is rejected on Monday.
SPX daily BBs chart:

SPX closed back over the 5dma yesterday, currently at 3617, so SPX is back on the Three Day Rule. If there is a close back below that today or Monday of at least five handles below, then we will very likely see a retest of yesterday’s low at 3491.58 before a retest of the last rally high at 3806.91. On the current basis of calculation (after a small tweak in 2019), this rule has fixed and made target well over a hundred times since the start of 2007 without a single fail apart from two very near misses when a triangle was forming at the low.
SPX daily 5dma chart:

If SPX can break and confirm the close back over the daily middle band then the next big target and resistance area would be the possible double bottom resistance at 3806.91 supported by the declining resistance from the 4325 high, now in the 3835-40 area and declining of course. A break and rejection over that would again look for a retest of the lows. A hard break over that level would look for a minimum target in the 4030 area, at which point I would be starting to take the possible swing low scenario here more seriously.
SPX 15min chart:
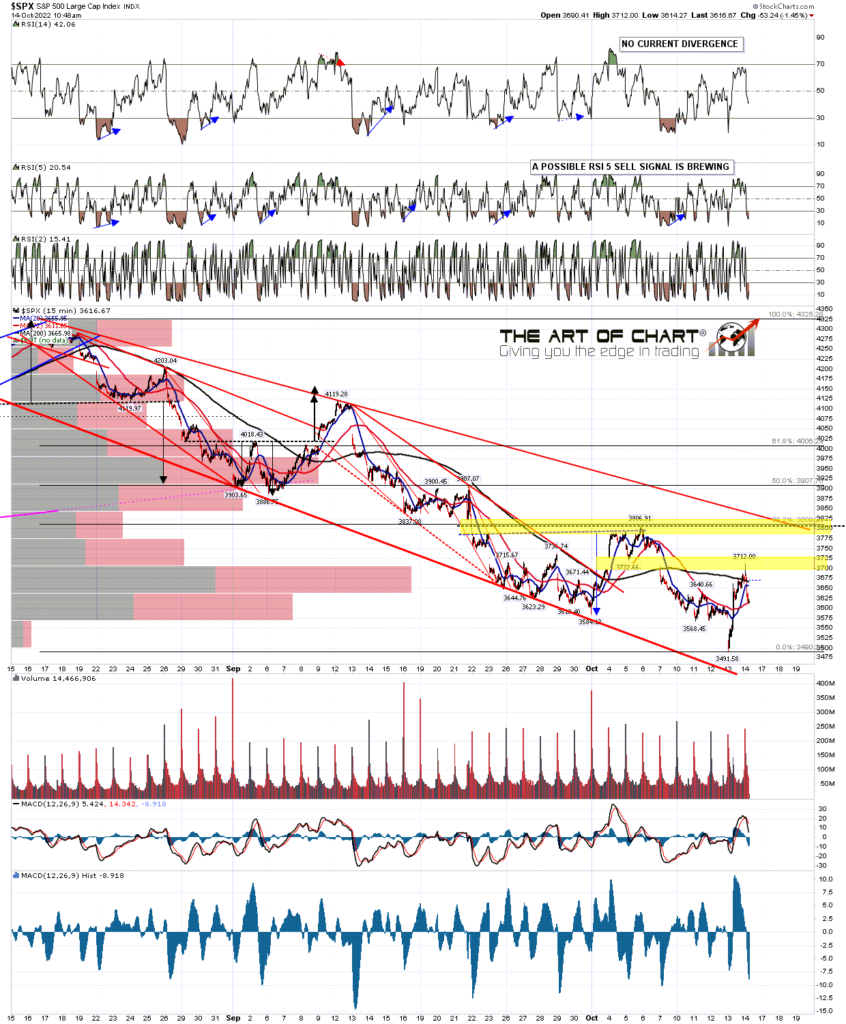
I’m still keeping an open mind on a break over the daily middle band here, though the initial rejection there this morning isn’t encouraging for bulls. We’ll see, but if we see a clear break back below the SPX 5dma today or Monday then I’ll expect a retest of the lows soon after, and if that retest is seen then SPX may well be on the way down to the next serious trendline support now in the 3350 area.
My next post should be on Monday or Tuesday before the open. Everyone have a great weekend. 🙂
 14th Oct 2022