I had an interesting December with a nasty case of COVID after I moved, and a slow and intermittent recovery. Feeling better now and I lost a stone over the month so my January diet was at least cancelled. 🙂
So where are we now on SPX after the rally from the low in mid-November? Well I was watching for resistance breaks on the upside and, so far at least, there haven’t been any on SPX.
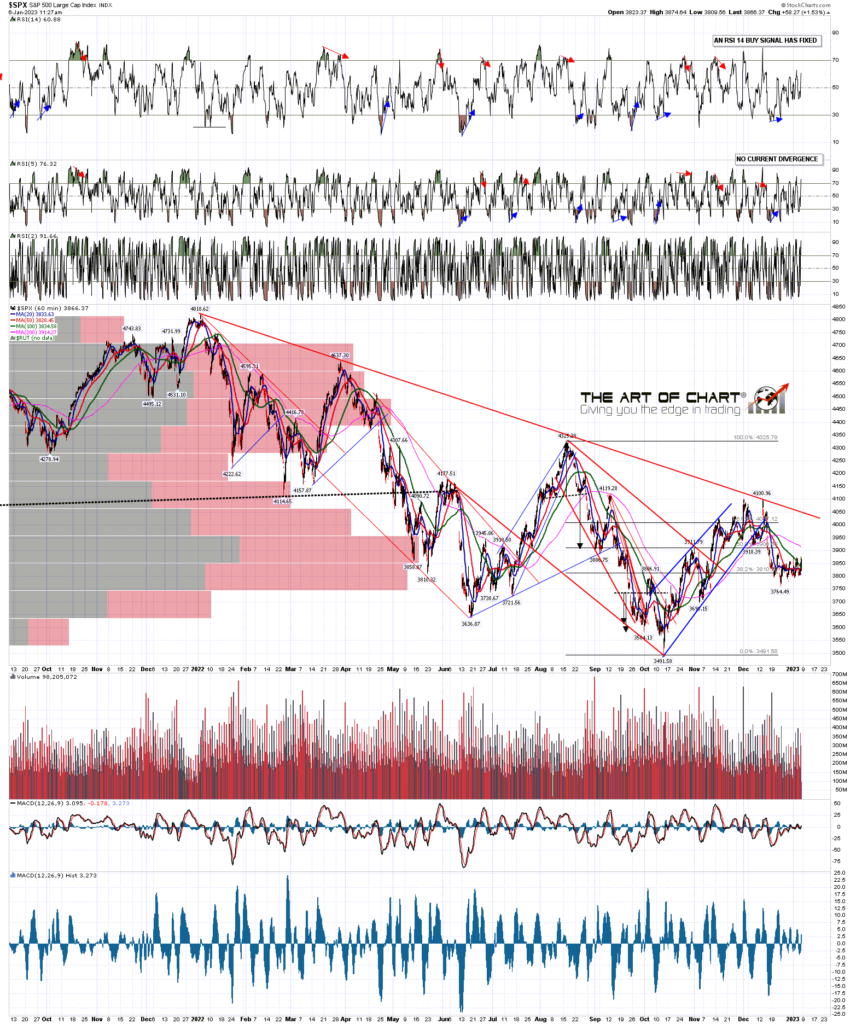
On the SPX hourly chart below you can see that the rally high was a perfect touch of declining resistance from the all time high. The hard fail there that just confirmed the downward trend.
SPX 60min chart:
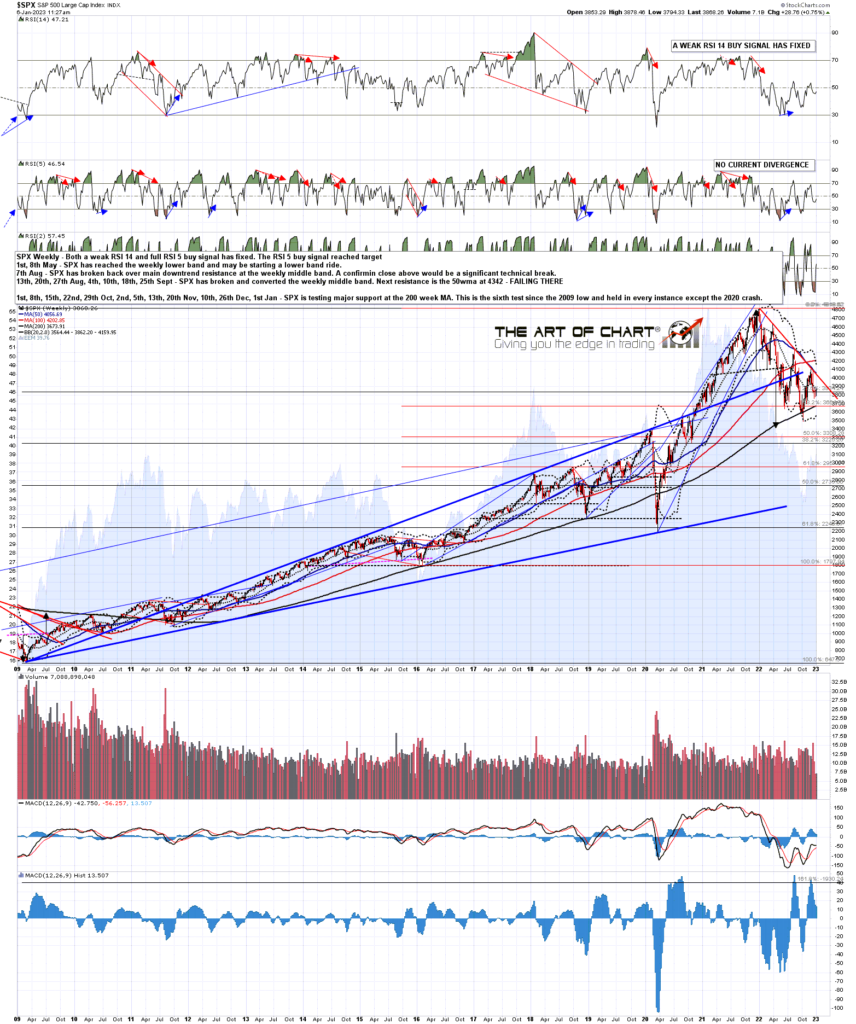
On the weekly chart the last rally failed at the test of the 50 week moving average and, so far, that is exactly where this rally has failed too. Again, so far this is just confirming the overall downward trend and the next obvious bigger picture target is a lower low below the last low at 3491.58.
There is a complication though. The obvious main resistance on the weekly chart is at the 50 week MA, now at 4056.69, but the obvious main support is at the 200 week MA, now at 3673.91. That was broken briefly when the last low was made, but there was no close significantly below it. As this has been the main support on SPX since 2009, and the only significant break below it since 2011 was during the 2000 crash, I am treating this as the key support level on SPX. If this is broken and converted to resistance then a lot of lower targets are opened up as serious possibilities.
SPX weekly chart:
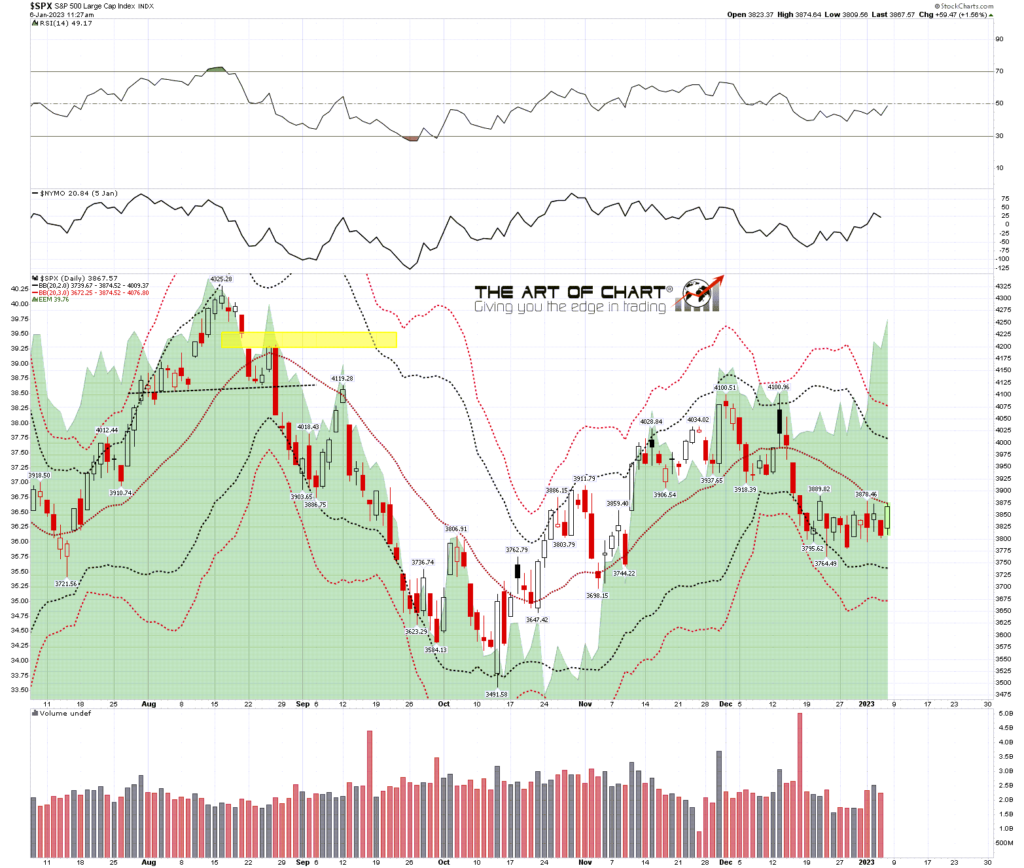
On the daily chart I would note that a daily RSI 5 buy signal has fixed, so if we see a confirmed break back over the daily middle band then there is a possibility that we may see a short term run higher.
On the downside though, if SPX makes a lower low under 3491 then there is still off course an open H&S target in the 3400 area that would be very much in range. I’ve been looking carefully at possible support trendlines and unfortunately I don’t have a high quality target trendline, but the best I have is currently in the 3350 area. That trendline needs confirmation but I’ll be bearing it in mind.
SPX daily chart:

For today I would note that the daily middle band is currently at 3874 and is being tested at the moment. If we see a clear break above now that is confirmed with another close above on Monday then there is enough positive divergence here on the daily and hourly charts to see a possible rally to the upper band in the 4000 area, but until we see that happen the daily middle band is an obvious level to reverse back down.
SPX daily BBs chart:
On the 15min chart the action from the last short term low at 3764 could be a triangle forming, but either way it looks like a bear flag forming. That has me leaning towards a reversal back down from the highs today.
SPX 15min chart:

It’s great to be back and mostly recovered. I’m not often ill and I really dislike it. Planning to resume my normal schedule from here.
A couple of things to mention and the first is that we are holding our free monthly public Chart Chat at theartofchart.net at 4pm EST on Sunday and we will be making some forecasts for 2023 on the many different indices, commodities etc that we cover there. If you’d like to attend you can register for that here or on our January Free Webinars page.
The second thing is that today is the last day of our holiday sale, so if you’d like to buy an annual membership then today is the day. If you’re interested then you can find the page for that here.
My next post should be on Monday or Tuesday before the open. Everyone have a great weekend. 🙂
 06th Jan 2023