The possible H&S I was looking at on Friday morning didn’t form and the move to retest the prior high has done some interesting technical damage to the bear case, so I wanted to have a look at that this morning.
The SPX hourly chart below shows the break over declining resistance from the all time high, which held perfectly at the December highs and established a high quality three touch resistance trendline.
On the bigger picture there is also a decent case that a falling wedge has formed from the all time high on SPX that could be a bull flag. That flag wedge would have underthrown bullishly at the October low and this might therefore be the start of a break up towards a possible retest of the all time high.
For a variety of reasons I am skeptical about that happening here but this is nonetheless certainly an interesting development and I’ll be watching carefully to see whether this can follow through to the upside and convert the main downtrend resistance, which is of course the 50 week moving average.
SPX 60min chart:
The possible bull flag on NDX is nowhere near as convincing, but there was also a break over declining resistance from the all time high on NDX yesterday.
NDX 60min chart:
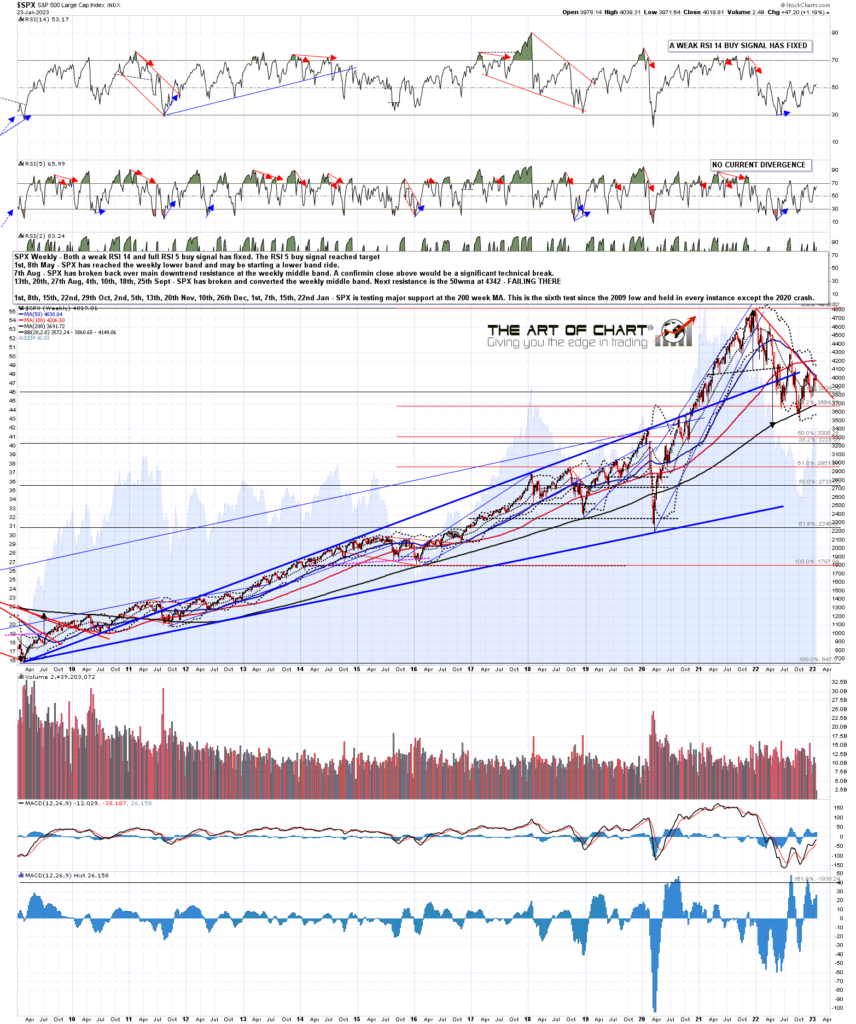
Main resistance for the current downtrend of course is at the 50 week MA, and there were close touches of this at the August and December rally highs. That is now at 4030.04 so the high yesterday was another close touch. If bulls can break and convert this to support then the possibility of a retest of the all time high will become an option on the table.
SPX weekly chart:
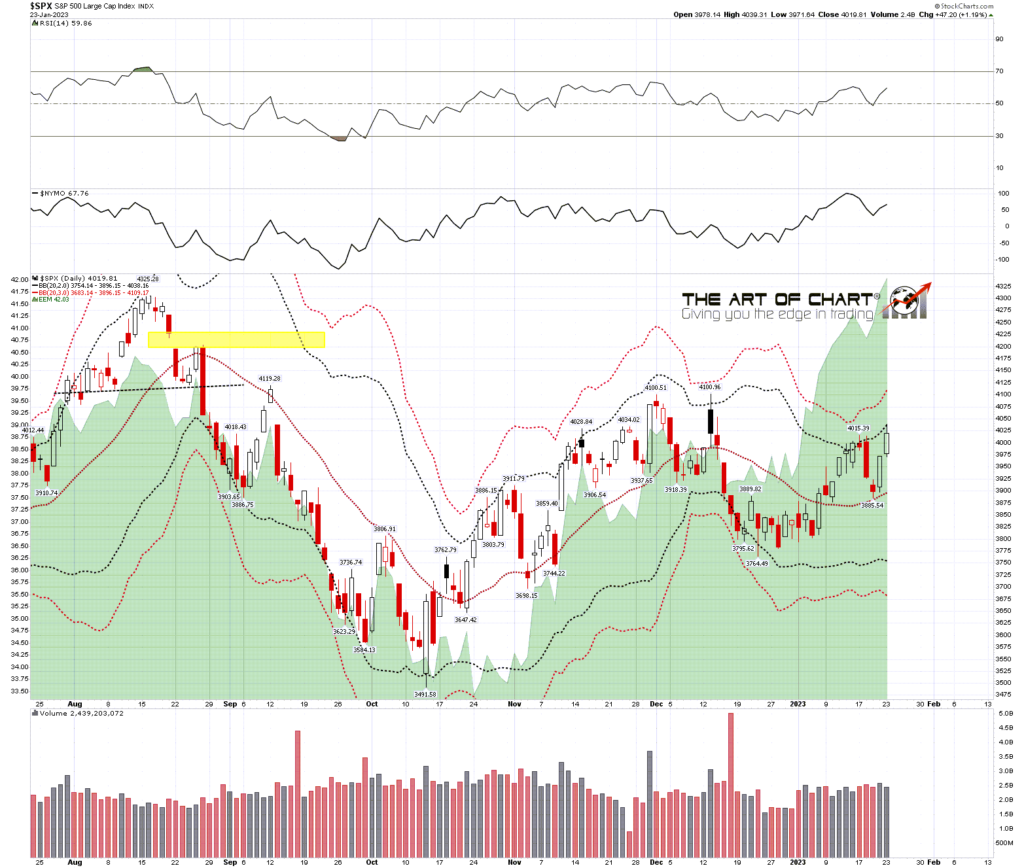
In the short term SPX is retesting the daily upper band so there is some resistance here. No current negative divergence on the hourly chart but that could be easily fixed with a retest and fail at yesterday’s high.
SPX daily BBs chart:
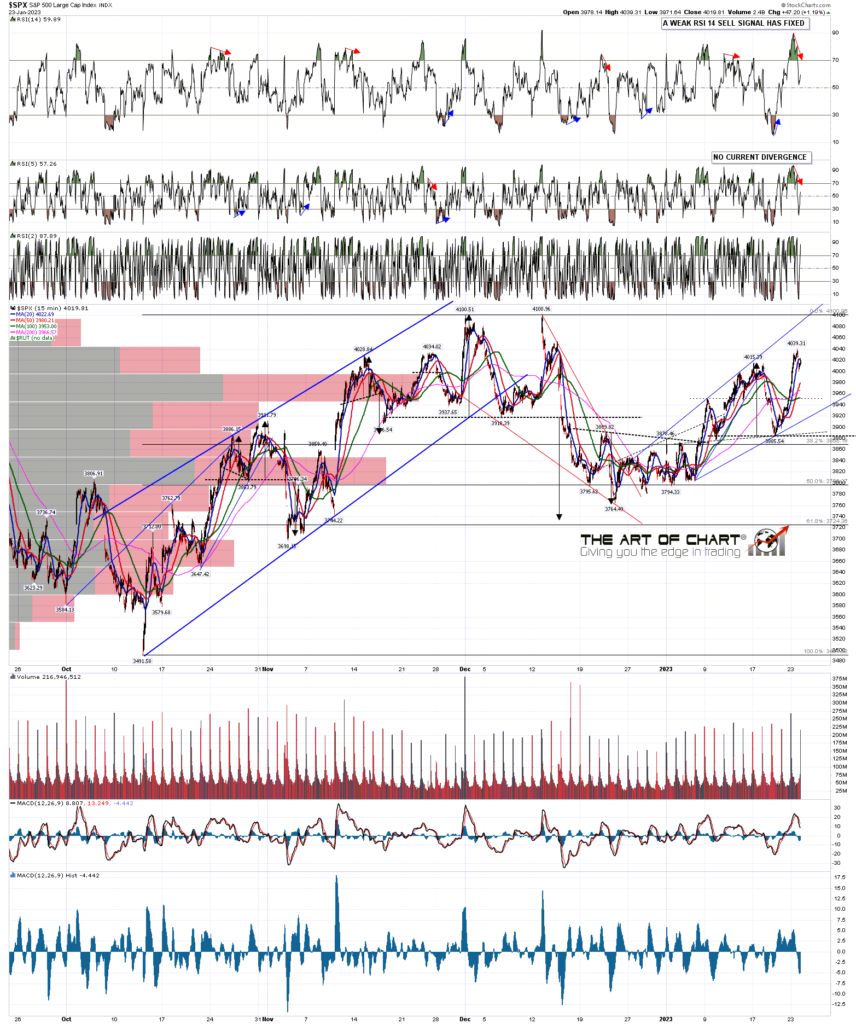
On the 15min chart the obvious pattern from the December low is a rising megaphone and, if so, the obvious resistance trendline would be in the 4080-5 area at the moment. Obvious SPX could be on the way to a retest of the December high and, if so, that is another potential point of failure, setting up a possible double top to retest the October low. We’ll see.
SPX 15min chart:
How significant is this resistance break? Well even if the 50 week MA breaks and converts to support, a retest of the all time high is not the only option. SPX might just be establishing a new rally resistance trendline and, if seen, I have a possible channel resistance trendline not far above the December high that I’d be keeping an eye on.
We are are holding our monthly free big five and key sectors webinar an hour after the RTH close at 5pm EST on Thursday 26th January. If you’d like to attend you can register for that here or on our January Free Webinars page.
My next post should be on Thursday or Friday before the open.
If you are enjoying my analysis and would like to see it every day at theartofchart.net, which I co-founded in 2015, you can register for a 30 day free trial here. It is included in the Daily Video Service, which in turn is included in the Triple Play Service.
 24th Jan 2023