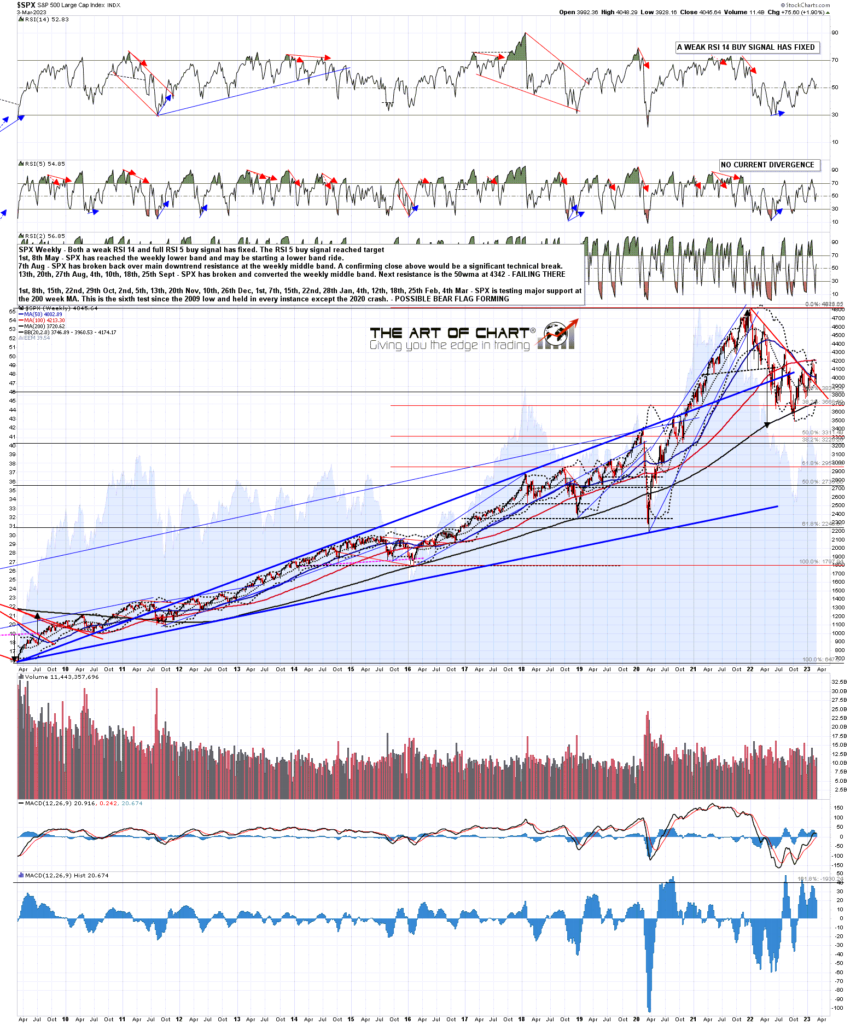
Support has been tested hard over the last couple of weeks on SPX, and the week before last there was a potentially interesting break below the 50 week moving average, currently at 4002, and then a test of the weekly middle band, now at 3960. Had SPX managed to close last week again below the 50 week MA, that would have been an important technical break down, and any subsequent break below the weekly middle band might have opened a serious break to the downside.
However SPX rallied on Friday to close well above the 50 week MA, so the break lower was rejected, and support at the weekly middle band has held the last two weeks. So where does that leave SPX?
SPX weekly chart:
At the low last week there was clear positive divergence on the daily RSI 5 on both SPX and NDX. That fixed on the late week rally into two daily RSI 5 buy signals, neither of which has reached target yet, so I’m expecting to see at least some more upside on both.
SPX daily chart:

How much further upside should we see? Well I was updating my charts at the weekend and, while I’m thinking we might see some retracement in the next day or two, there is a decent looking bull flag channel formed on the SPX 15min chart from the 4195 high, and the obvious next target within that flag would be channel resistance, currently in the 4098 area. A decent quality double bottom broke up on Friday with a target in that area.
SPX 15min chart:

On NDX there is another decent looking bull flag channel, and the next obvious target within the flag would be channel resistance, currently in the 12440 area. Again there is a decent quality double bottom that broke up on Friday with a target in that area.
NDX 15min chart:
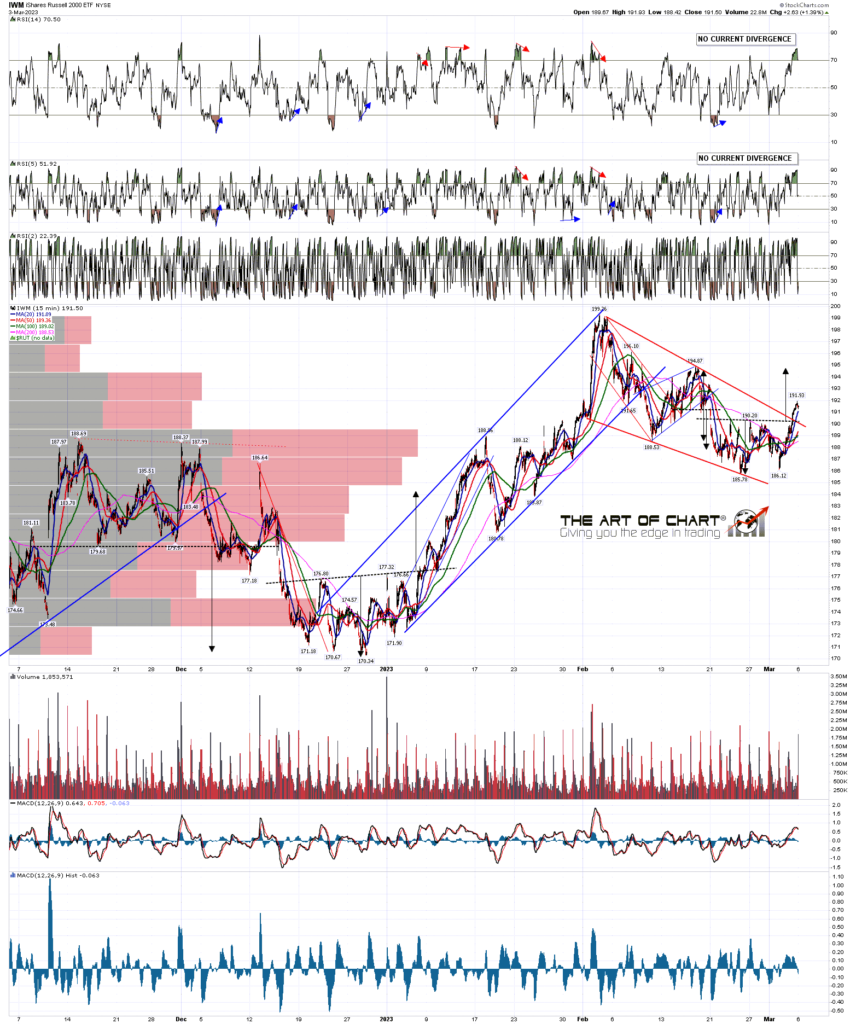
There is a third bull flag setup on IWM, not a channel and this one has already broken up, with a possible target back at a retest of the Feb high at 199.26, and an IHS target that broke up on Friday in the 194.7 area.
IWM 15min chart:
We could see this bullish leaning setup fail this week, with the uncertain economy, more interest rate rises coming, and two Fed speakers this week, but this is very much a bullish leaning setup, leaning towards at least some more upside and very possibly setting up a retest of the February highs across the board on US indices, though that could just be establishing a series of bearish double tops of course.
In the short term I’m hoping to see a retracement to backtest the weekly pivot on SPX at 4007.25, that could set up a nice long for the rest of the week that could take SPX up a couple of hundred handles. I’d enjoy trading that so we will see.
On Sunday this week we are doing our monthly free public Chart Chat at theartofchart.net, and if you’d like to see that you can register for that here, or on our March Free Webinars Page.
If you are enjoying my analysis and would like to see it every day at theartofchart.net, which I co-founded in 2015, you can register for a 30 day free trial here. It is included in the Daily Video Service, which in turn is included in the Triple Play Service.
 06th Mar 2023