I was writing about the very attractive looking bull flag setups on SPX, NDX and IWM that are setting up possible tests of the February highs. We saw the retracement that I was expecting then but SPX has broken back below the weekly pivot at 4007 on the press conference yesterday by the Fed Chairman.
The markets are very used to doveish noises being made by the Fed, but these are not normal times, and the Fed has been stepping up to their duties to fight inflation with real enthusiasm. Powell has been trying to get this point across and in his press conference yesterday restated his view that interest rates would be unlikely to top out at under 6%, that the stronger than expected economic data recently was only hardening the Fed’s hawkishness on interest rates, and added that unemployment might need to be two million higher to deliver the slowdown necessary to deliver lower inflation.
Looking at bonds this morning I’m still not sure that the markets believe that the Fed is serious about this, but I believe Powell. Unless he steps up to the plate on inflation here he risks becoming a cautionary example for the next generation of economists and central bankers, and he doesn’t want to risk that.
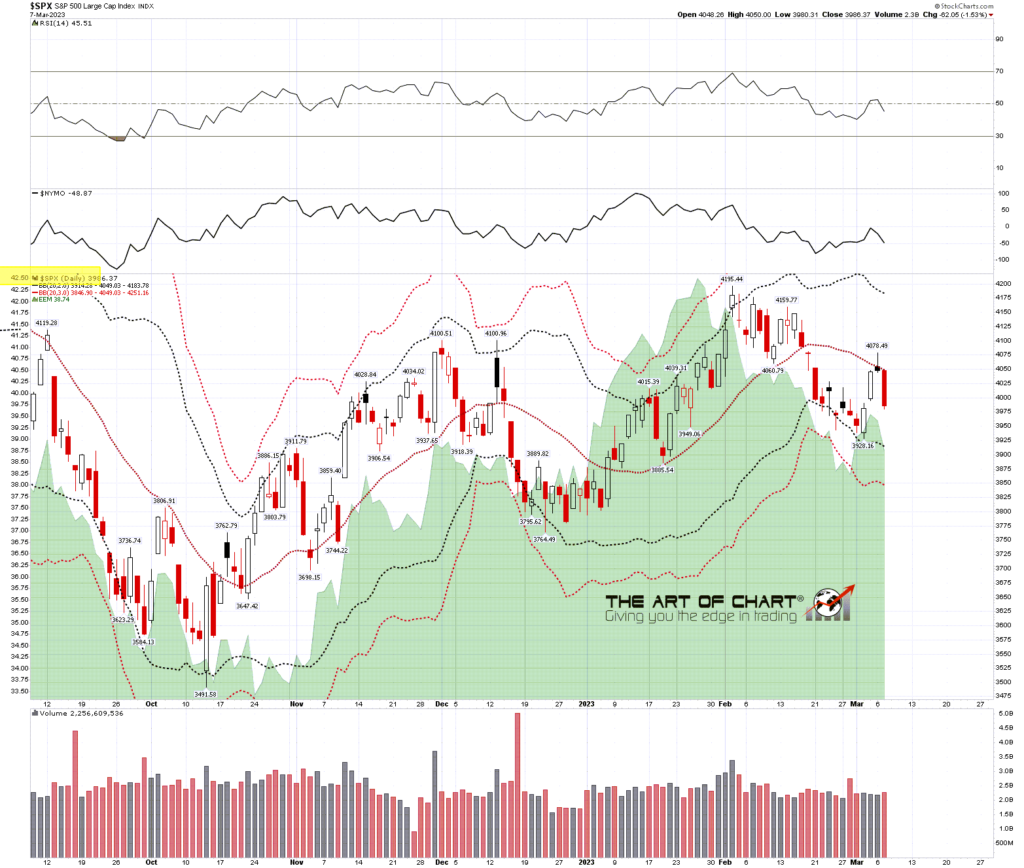
To open the downside however there are a couple of key levels that need to be converted to resistance. The daily middle band now at 4049 is holding as resistance already, but SPX also needs to break and convert the 50 week MA now at 3992, and the weekly middle band, now at 3972. These are being tested now and that break and conversion opens the downside.
SPX weekly chart:

The daily middle band was tested as resistance at the highs this week and held. If we are to see a break up, then that needs to be broken and converted to support.
SPX daily BBs chart:
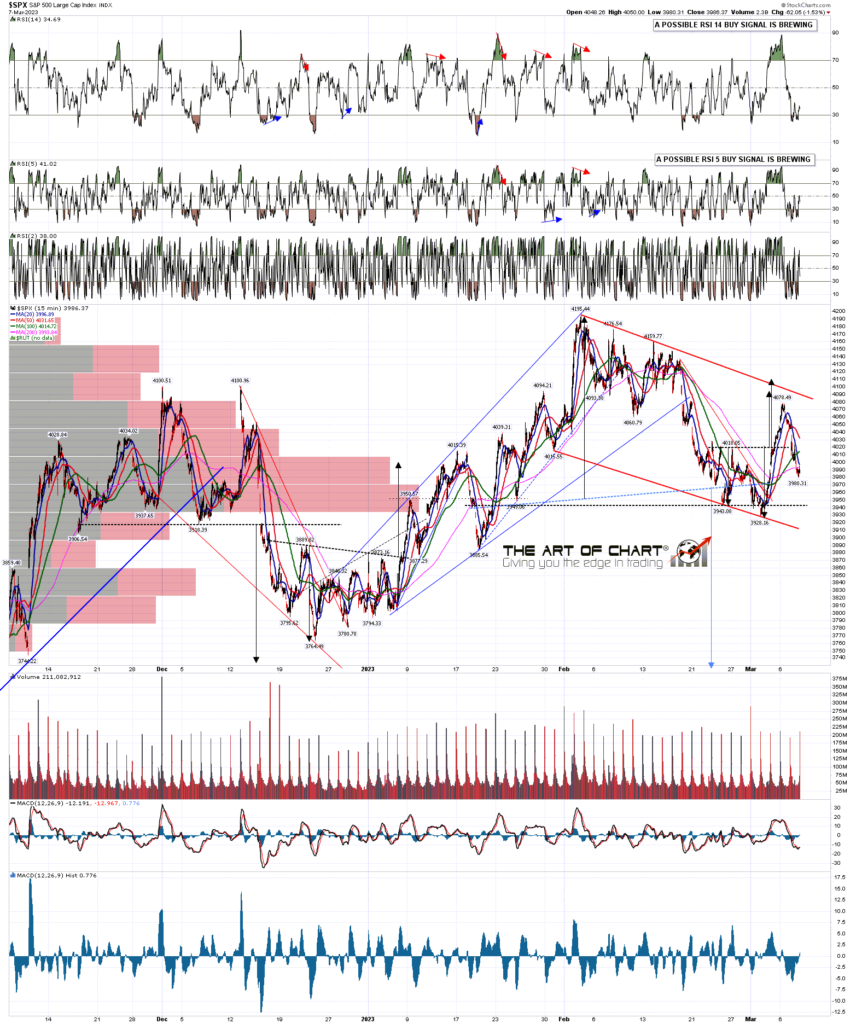
How much further upside should we see? Well the flags I posted on Monday are all still in play and on the SPX 15min chart there is a possible bull flag channel from the 4195 high, and the obvious next target within that flag would be channel resistance, currently in the 4090 area. A decent quality double bottom broke up on Friday with a target in that area and is still valid.
SPX 15min chart:
On NDX there is another decent looking bull flag channel, and again there was a decent quality double bottom that broke up on Friday with a target in that area and made target. The resistance trendline broke slightly and if we see that break again that will look significantly bullish into a retest of the February high.
NDX 15min chart:
There is a third bull flag setup on IWM, not a channel and this one has already broken up, with a possible target back at a retest of the Feb high at 199.26, and an IHS target that broke up on Friday in the 194.7 area. That IHS target is close to failing though, and a move below the right shoulder low at 186.12 would look for a full retracement back to 185.78.
IWM 15min chart:

We may be about to see this bullish leaning setup fail this week, with the uncertain outlook for the economy, more interest rate rises coming, and the Fed being unusually honest about their bearish leaning plans for interest rates. About 30% of bull flags break down of course, and I see that happen regularly. We shall see.
In the short term I’m hoping to see a retracement to backtest the weekly pivot on SPX at 4007.25, to see whether it holds as resistance. If SPX breaks back up through it with confidence then the bullish scenario back into the February highs retests is still on the table. I’d enjoy trading that but under the circumstances I’m doubtful.
On Sunday this week we are doing our monthly free public Chart Chat at theartofchart.net, and if you’d like to see that you can register for that here, or on our March Free Webinars Page.
If you are enjoying my analysis and would like to see it every day at theartofchart.net, which I co-founded in 2015, you can register for a 30 day free trial here. It is included in the Daily Video Service, which in turn is included in the Triple Play Service.
 08th Mar 2023