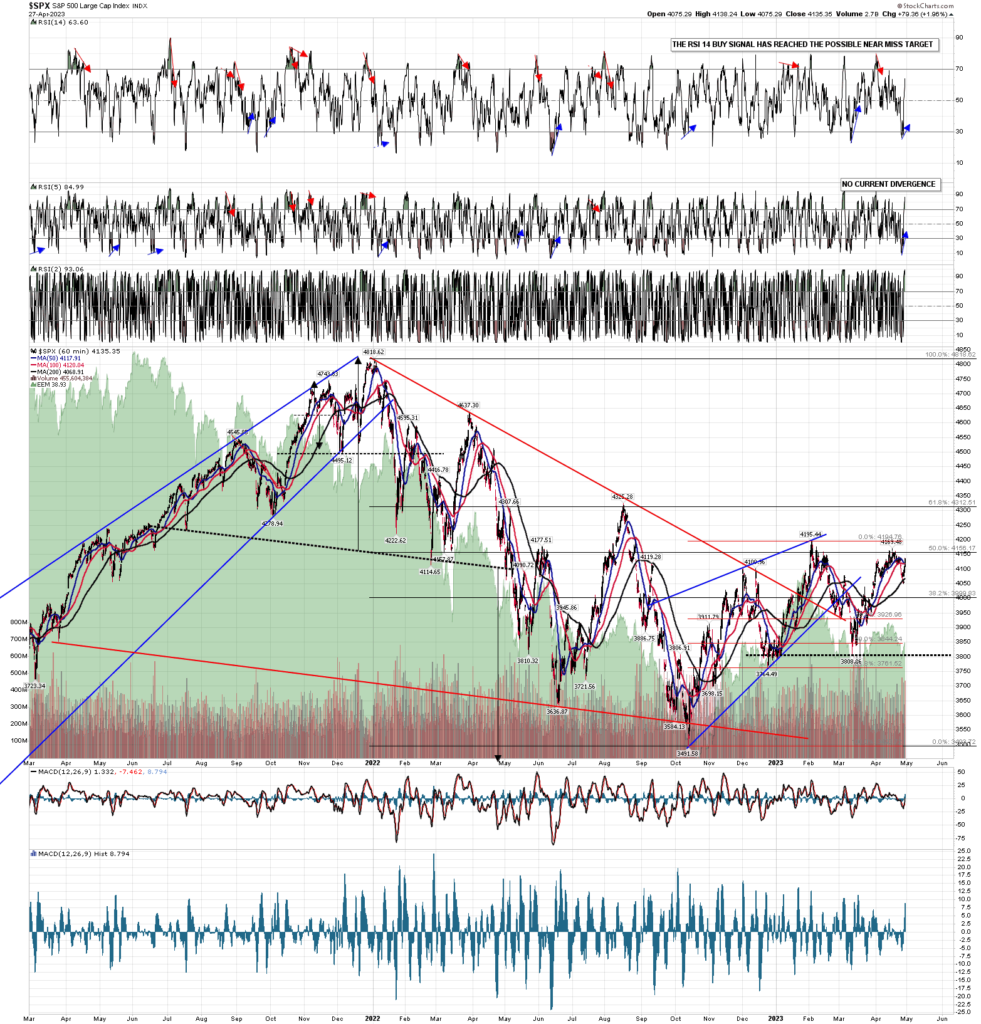
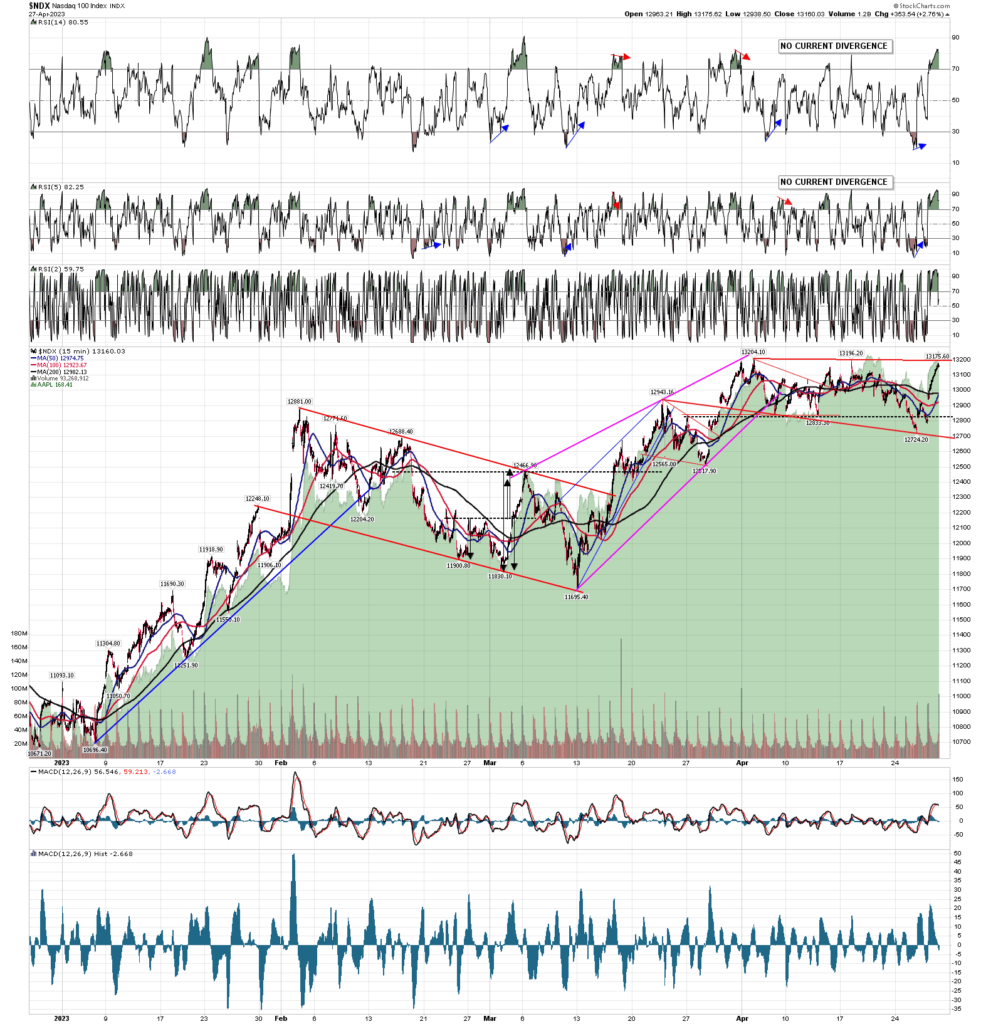
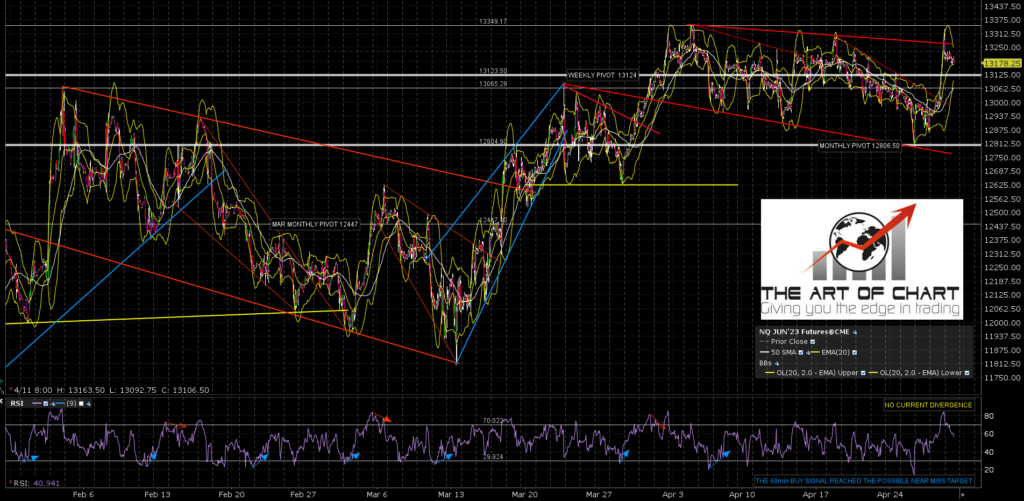
SPX went down a little further than was ideal, and then rallied very hard yesterday, so the topping pattern scenario is still on track.
The break below the daily middle band confirmed on Wednesday and SPX broke back hard over the middle band again yesterday. A close over 4115 again today will confirm the break back above. There is the option of a hard rejection back below that today, which would be unusual on a Friday, but definitely possible as today is the last day of April, and the stats for that lean 67% bearish.
SPX daily BBs chart:
Is the H&S option still on the table? Yes, though the neckline isn’t ideal and SPX has gone a little high on the right shoulder, but the option of heading 30 handles higher into the retest of the April high at 4169.48 looks more likely than it would have done if SPX had turned directly up from Tuesday’s low.
SPX 15min chart:
In the short term I think the odds are 75%+ that SPX is topping out short term for at least a decent retracement, and I am looking for a topping pattern. That pattern may still be an H&S forming, and the next move would ideally be to rally a little higher, and then fail hard into the H&S target in the 3910 area. We’ll see if this plays out that way. There is an increased chance that we see a full retest of the 4169.48 high and, if seen, that would be an easier short as SPX could set up better negative divergence on the way there. Everyone have a great weekend. 🙂
If you are enjoying my analysis and would like to see it every day at theartofchart.net, which I co-founded in 2015, you can register for a 30 day free trial here. It is included in the Daily Video Service, which in turn is included in the Triple Play Service.


 28th Apr 2023