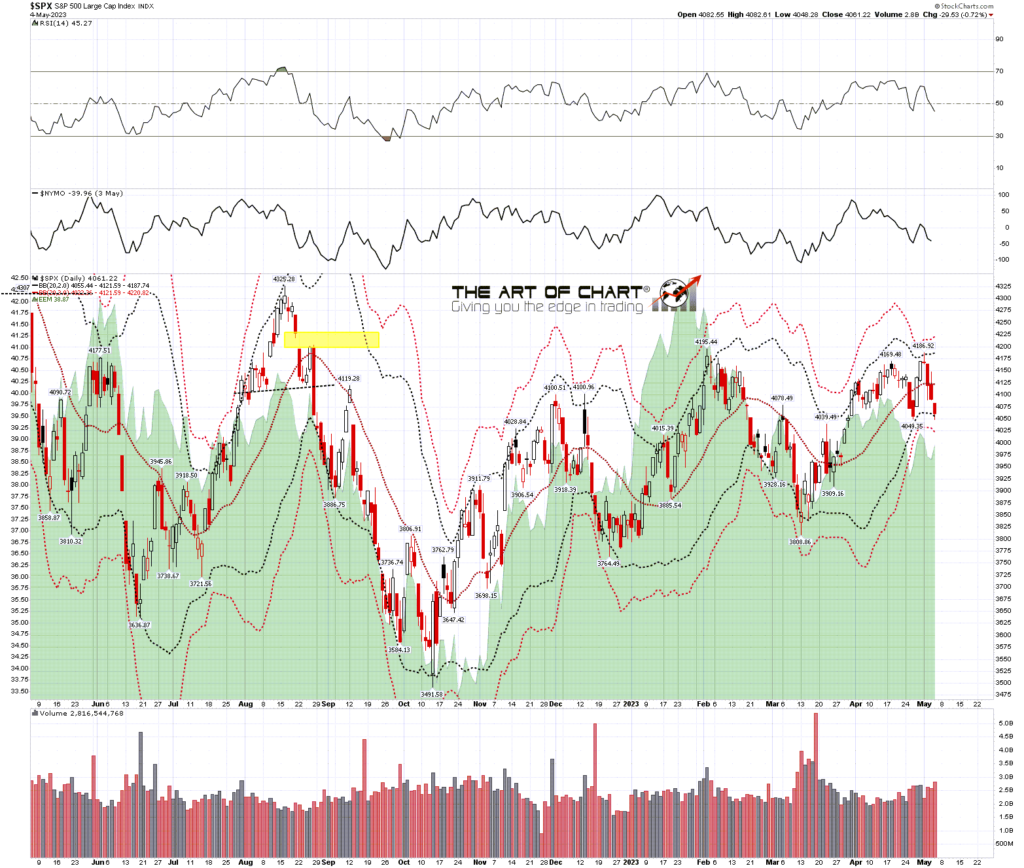
So far, the reversal at strong resistance at the monthly middle band and the main support/resistance trendline from the 2009 low is proceeding as expected. The next three weeks lean bearish, with strongly bearish leaning days Thursday 11th May, Wednesday & Thursday 17th & 18th May before we see the next strongly bullish leaning day on Thursday 25th May. This is a good time for SPX to turn down and do some significant damage to the downside.
In the short term the downtrend has started well, the daily middle band, and weekly and monthly pivots at 4130 have been converted to resistance and SPX tested the daily lower band yesterday.
Generally speaking there is a bullish lean on Fridays and the low on SPX yesterday was only 25 handles above the 3sd lower band. The 3sd lower band is a big resistance level, and there hasn’t been a break below it for over a year, so I’m not seeing any obvious reason to see that tested now. The daily middle band is still turning down and the bands are only starting to expand so short term downside looks limited and today looks like a good day for a modest rally.
The first obvious strong resistance is at the daily middle band, currently at 4121.
SPX daily BBs chart:
On the hourly chart the 50 hour MA tends to be good, albeit rough, support in an uptrend and resistance in a downtrend. That is now in the 4116 area and is reinforcing the daily middle band as resistance here so the obvious closing resistance today is in the 4120 SPX and 4140 ES areas.
If we should see a closing break over the daily middle band today that could be a break up, unless that is negated by a rejection candle back down on Monday.
SPX 60min chart:
The double top on SPX has broken down slightly with alternate targets in the 3930 and 3905 areas. Larger double top support is at 3808.86.
SPX 15min chart:

NDX has been making good progress towards the double top support in the 12724 area. NDX has been outperforming SPX and Dow over the last few weeks and, so far at least, that is still the case.
NDX 15min chart:
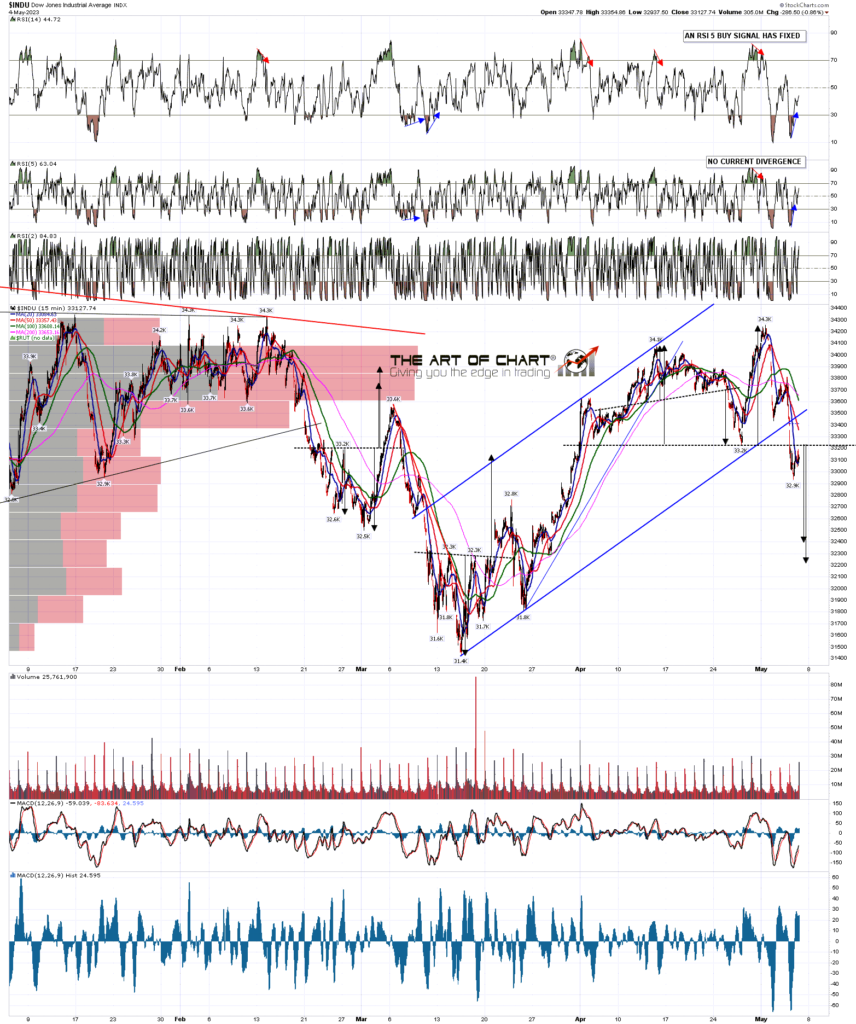
Dow has broken below double top support at 33.2k with alternate double top targets in the 32.4k or 32.2k areas. That would put INDU within striking distance of the larger double top support at 31.4k.
INDU 15min chart:
In the short term I think the odds are 75%+ that SPX has topped out short term for at least a decent retracement, and we now have topping patterns breaking down. Is there a chance that SPX will break up over resistance here instead of failing? Always, every good setup can always fail and go the other way, and I have assigned a probability of 25% to that, though in practical terms I think the odds of that would be more like 15% to 20%.
I set up a modestly sized model trade for the next few months and am following it here. I entered that with 9x MES (micro-ES) just before the close on Friday 28th April at 4190. 10x MES is equivalent to 1x ES, so this isn’t a large trade, but I’m planning to trade around it on the way down.
The entry was at 4190, the target is at 3430, 760 handles below. The stop for the trade was 70 handles above at 4260 (at which point SPX would likely be breaking up), so the risk/reward ratio is slightly over 1:10, though if the trade needs to be rolled that will likely reduce a bit below that. As the initial double top has now broken down I have moved the stop to even at 4190. If that is stopped out I would likely re-enter at a retest of the May high. Max risk on the trade was $3,150, and if taken off at target without the need to roll the trade will yield $34,200. I will consider taking a third off near the 3940 and 3690 areas if seen, and perhaps adding them back on after any subsequent rallies. We’ll see how that goes, but at the time of writing this trade is currently up about 80 handles.
At 4pm EST on Sunday 7th May we are doing our monthly free public Chart Chat at theartofchart.net looking at many aspects of the equity, bond, crypto and commodities markets. If you’d like to see that you can register for that here, or on our May Free Webinars page.
If you are enjoying my analysis and would like to see it every day at theartofchart.net, which I co-founded in 2015, you can register for a 30 day free trial here. It is included in the Daily Video Service, which in turn is included in the Triple Play Service.
 05th May 2023