I’m expecting to see a retracement of the move up from the October lows start soon, and there are some targets I wanted to see made on equity indices before that happened. The last two of those were made on Friday.
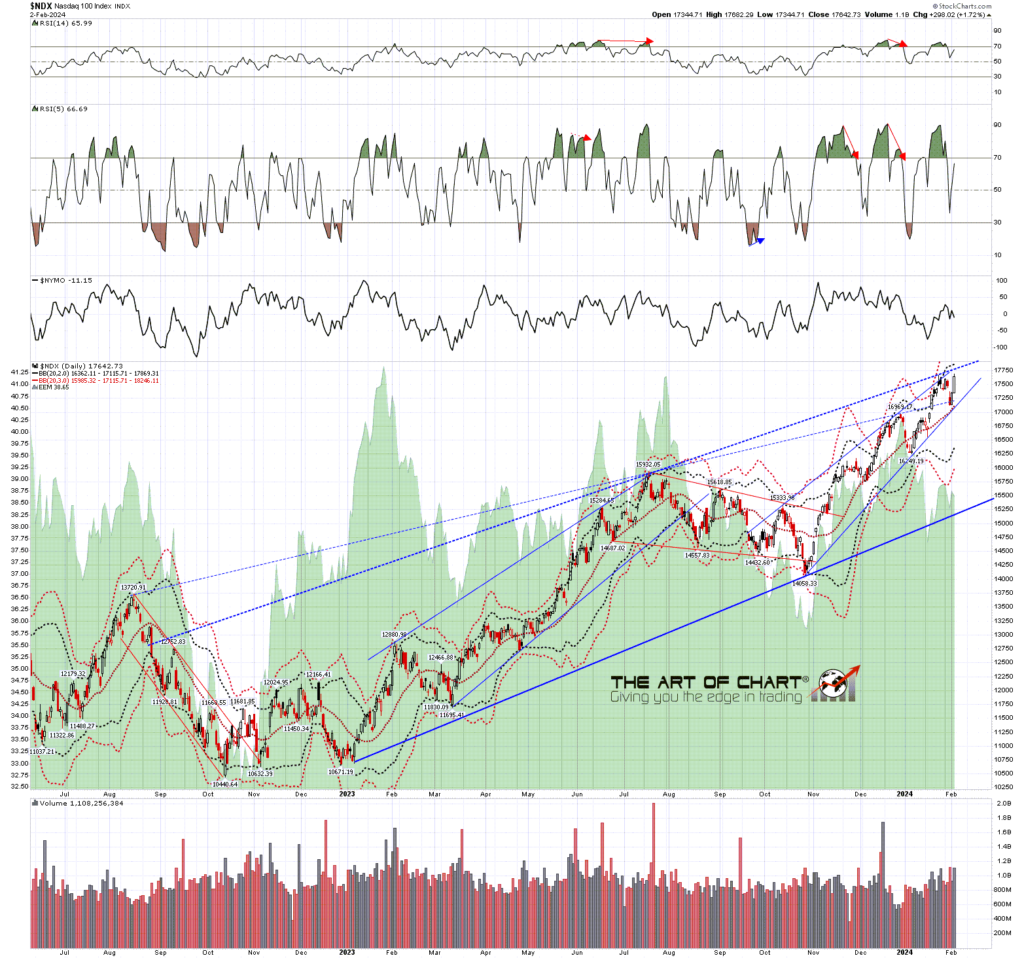
The first of those was a retest of the all time high on NDX, and we saw a new high there on Friday, with a very nice looking overall rising wedges from both the 2022 low and the October 2023 low. This looks ready to turn soon.
NDX daily BBs chart:
The second of those, less important but still significant, was a retest of the all time high on DAX, the main german index, and that too was hit on Friday. As with NDX that has set up a very nice looking possible short term double top.
DAX daily chart:
So is SPX ready to turn? I remember in a premarket video a couple of weeks ago I was asked whether SPX was stretched enough against the 45dma to suggest a retracement coming imminently, and I replied that SPX could easily do 5000 before that was the case. The high on Friday was at 4975.25 and that was 4.83% above the 45dma. It could go a bit higher as over 5% wouldn’t be unusual.
SPX daily vs 45dma chart:

SPX came off the daily upper band ride last week and returned to make a high on Friday slightly above it. The upper band ride is probably not resuming but if the upper band is hit again today I’d be looking for that hit in the 4980-5 area.
What I’m mainly looking at on the chart below though is the rising wedge from the October low. I have been watching three higher probability possible resistance trendlines from that low and the first has now been broken in a way that does not look like a bearish overthrow. The next option is a very high quality one and SPX may well be heading there. I have that currently slightly over 5000 SPX, and that trendline may need to be tested before a retracement of the move up from the October low can begin.
SPX daily BBs chart:

Looking on the hourly chart, showing a larger view of SPX from the 2022 low, there is double trendline resistance in that area, and I’d be looking for a hit this week in the 5010 to 5025 area ideally. After this week we have a few days that are seasonally weak so that wouldn’t be a bad time to see a short term high. If we do see that move and the retracement start my preferred target would be a backtest of the August 2023 high at 4607.07.
SPX 60min chart:
Whatever happens the tape has been looking more interesting over the last few days and this may well be a fun month or two to trade. On the bigger picture I would note that presidential election years tend to close green, and the January barometer has delivered a result also suggesting a green close this year. That’s worth noting, and I’m planning a post looking at the January Barometer indicator later this week.
I’ve stopped using a custom domain for my blogger posts so the address for those has reverted back to https://channelsandpatterns.blogspot.com/
If you are enjoying my analysis and would like to see it every day (including a daily premarket video) at theartofchart.net, which I co-founded in 2015, you can register for a 30 day free trial here. It is included in the Daily Video Service, which in turn is included in the Triple Play Service.
 05th Feb 2024