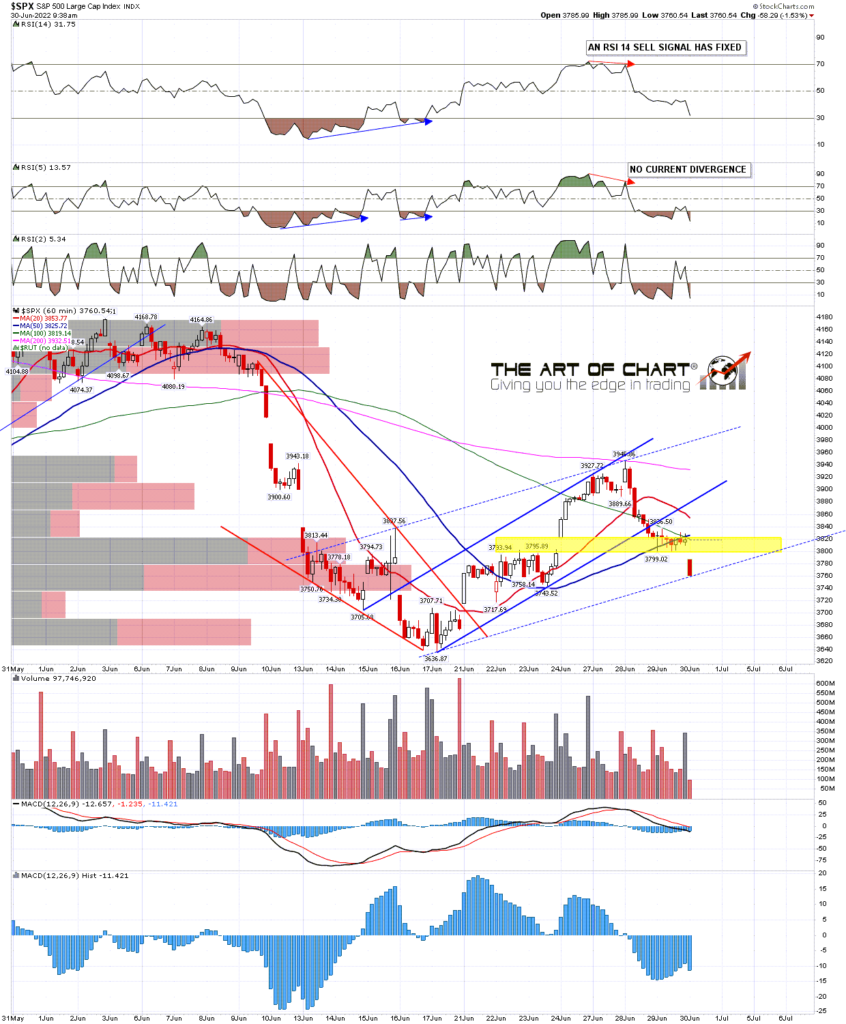
I posted this chart on my twitter on Wednesday night with the comment that SPX was reaching an important short term inflection point where it might go directly into a retest of the current 2022 low. I said that the strongest kind of break would be a gap through the gap support highlighted in yellow that then converted that to resistance. We didn’t see that yesterday, where the gap was tested but not filled, but at the time of writing a gap through that resistance looks likely and if the gap then converts to resistance then that would create a short term island top for the rally.
The timing isn’t ideal and this attempt to break down would have been better yesterday because today is the last trading day of June, and the 4th July holiday is on Monday. That’s not an issue today, with neutral historical stats, but the historical stats for tomorrow on SPX are 85% bullish and that is also both a Friday and the trading day before a holiday, so I’m skeptical about seeing any meaningful downside tomorrow. If we are going to see a retracement low retest therefore, it might need to be concluded today.
SPX 60min chart:
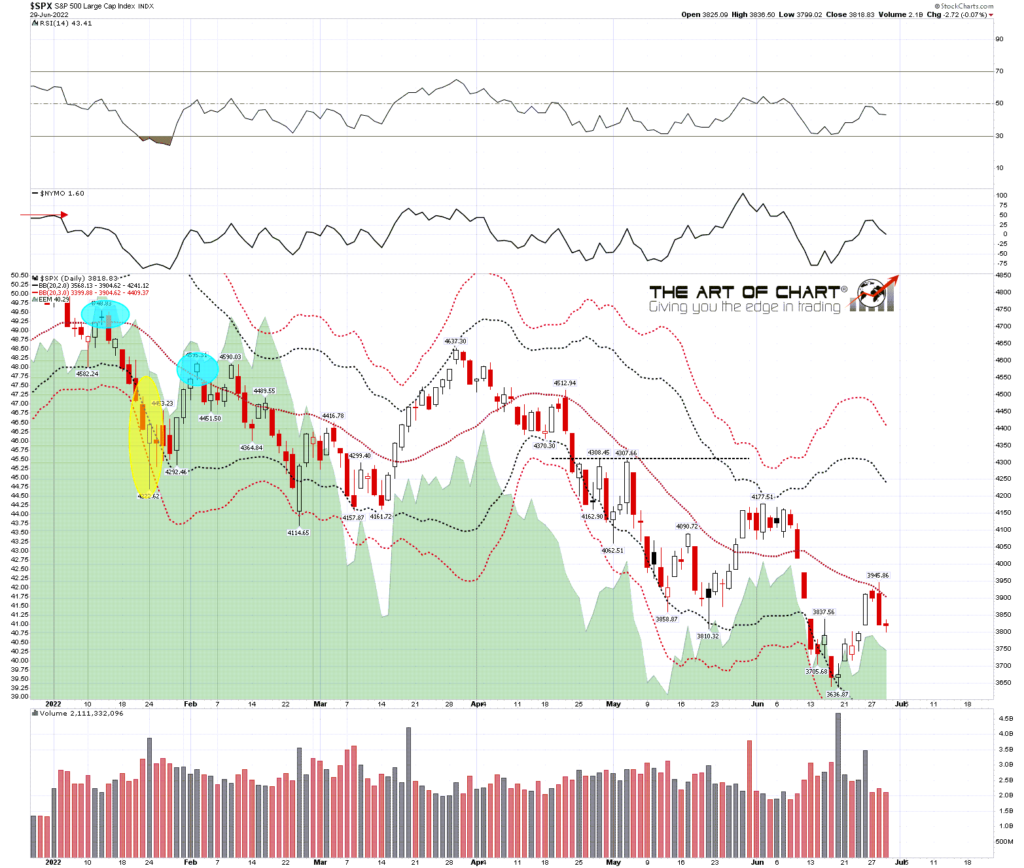
If we do see that low retest then that may well be the second low of a double bottom setting up a backtest of main resistance at the weekly middle band, now in the 4186 area. That would be a much larger inflection point as if SPX is going to deliver on the bull flag and retest the all time high, we would likely see a break and conversion of that to support to open the path to bull flag resistance, currently in the 4480 area.
SPX weekly chart:
There is an opportunity to retest the 2022 low today and I’d love to see that if it can be managed. If so I’d be looking for a very possible second low of a double bottom and that would then be backed up by the very bullish historical stats tomorrow and the modestly bullish stats Wednesday through Friday next week.
If we are going to see that then on any intraday rally I would like to see yesterday’s SPX low at 3799.02 respected to leave a high quality island top in place into that retest. If SPX can break back over 3800 and convert that to support then that low retest in the next few days would be much less likely in my view.
We hold a couple of sales on annual memberships every year at theartofchart.net, and the summer sale is now on, with an extra 20% off annual memberships, so eight months for the price of twelve. If you’re interested the sale page is here, the sale code is july4sale, and the sale is probably ending on Monday 4th July unless it is extended by a further day or two into latest Wednesday 6th July.
I should mention again that our Follow The Leader service at theartofchart.net is up 100% so far this year. The technology to support this service is provided by our partner, GFF Brokers. GFF Brokers is an authorized broker for the World Cup Trading Championships Advisor programs. The profits on that so far this year on the nominal account of size at $25k would be enough to pay the Triple Play subscription at the standard monthly price for ten years. Follow The Leader is included in the Daily Video Service and the Triple Play Service, which includes the Daily Video Service. If you’d like to try a free trial of the Triple Play service you can find that here.


 30th Jun 2022
Would be of great help if you write the time your post somewhere (beginning or end) since many times we read it later on…thank you!
I’ll ask Stan. Should be possible to add a timestamp when it is posted. It already has a datestamp.