Nice trend down for the first half day today. There is still an outstanding H&S target below on NQ in the 5975 area, but the strong support zone on ES in the 2539-43 has been tested with the LOD currently at 2541.5. That is a possible H&S neckline, and if a right shoulder forms the ideal right shoulder high would be in the 2561/2 area.
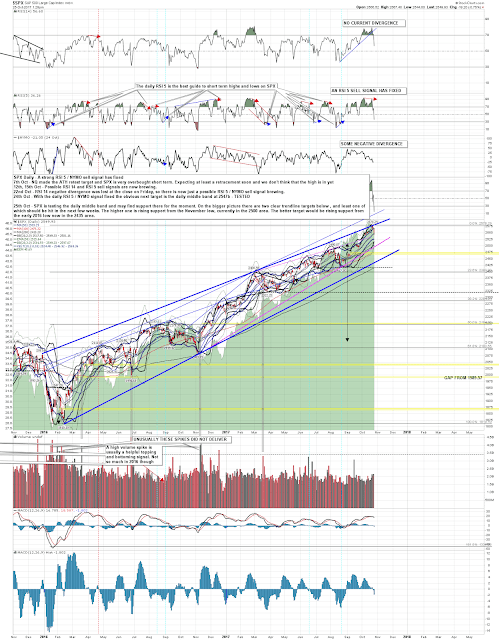
On the bigger picture the strong daily RSI 5 / NYMO sell signal that fixed on SPX is playing out, and it looks unlikely that will reach the possible near miss target today. That would fit with the possible H&S forming on ES, with would have a target in the 2507-12 area on a conviction break down. That is a decent match with the obvious first trendline support target on SPX, currently in the 2500 area. SPX daily chart:
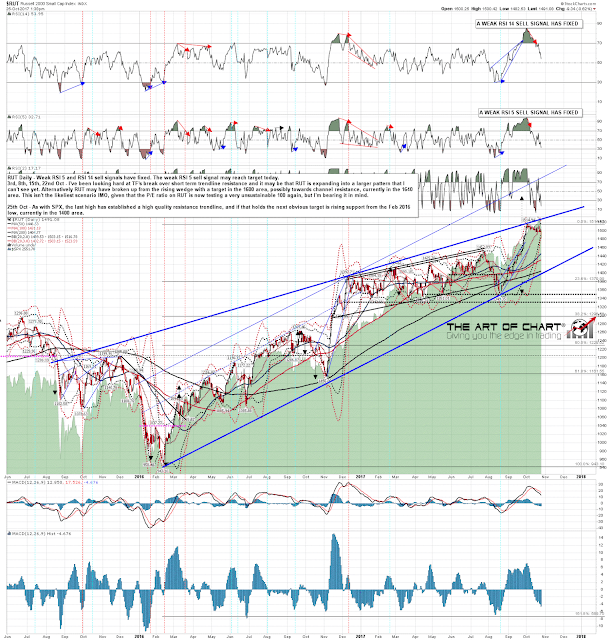
As with SPX, the recent highs on RUT have established a decent quality candidate resistance trendline for this move up from early 2016. If so the obvious next trendline target within this overall rising wedge would be rising support from the early 2016 lows, currently in the 1400 area. With the RUT P/E ratio currently at 115, it could certainly use some downside.
If any of you are wondering why the P/E ratio I look at for RUT is so much higher that that generally quoted, it is because that one has been adjusted to exclude all the RUT component companies that are losing money, which is certainly a way to make the numbers look better. Similar pioneering work has been done on improving inflation numbers by excluding necessities that are rising in price, but that doesn’t make it so, though it does explain why the inflation numbers produced nowadays bear ever less relation to the rising cost of living. If you torture data for long enough, it will tell you anything you want to know 🙂
RUT daily chart:
The ES, NQ and TF futures charts below were done before the RTH open for Daily Video Service subscribers at theartofchart.net. If you are interested in trying our services a 30 day free trial is available here.
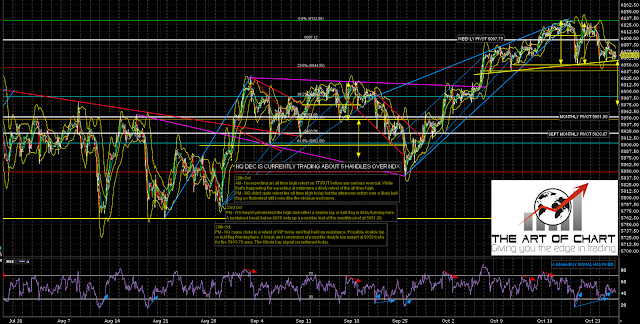
I was talking in my premarket video this morning about the strong support zone in the 2539-43 area and that has held the likely LOD at 2541.5. This zone is a possible H&S neckline and an ideal right shoulder high would be in the 2561/2 area, with the target on completion and sustained break below 2539 likely to be in the 2507-12 area. If you missed my posting that video on my twitter earlier, you can see that here and all the equity index analysis is covered in the first three minutes. ES Dec 60min chart:

NQ hasn’t made the H&S target in the 5975 area yet, but that will likely be hit after this rally from the lows today tops out. NQ Dec 60min chart:
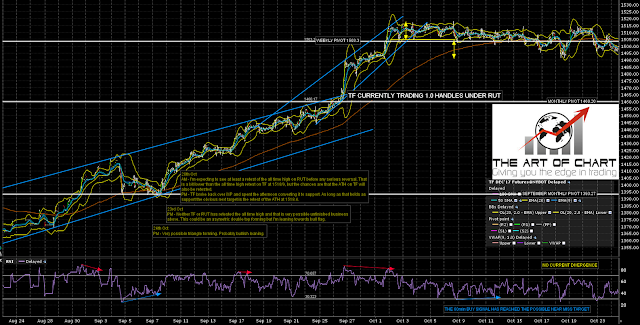
No clear short term downside target on TF, but I’ll be watching the monthly pivot at 1460 for possible support if reached. TF Dec 60min chart:
Stan and I are doing an educational webinar at theartofchart.net an hour after the close tomorrow on the use of MACD and moving averages in trading, and if you’d like to attend that you can register for that on the October Free Webinars page here.
I’ve been fighting a heavy cold this week, happily passing now, and also a serious technical problem on my main charting computer, which I’m planning to reload after I do my premarket video tomorrow. There is unlikely to be a post tomorrow but I will try hard to get one out on Friday.
 25th Oct 2017