I’ve been talking in my last few posts about expecting a significant high at the end of November, to be followed by a downward cycle into April 2020, and here we are at the end of November, so how’s that looking here? Well as it happens a rare and significant event happened at the close today that confirms the inflection point here and leans strongly towards seeing that retracement next.
Stan and I are from different schools of charting of course and are always looking for strong matches in our analyses across the many market that we cover at theartofchart.net as when we find them it strengthens the forecasts and this cross confirmation is a very nice one to see.
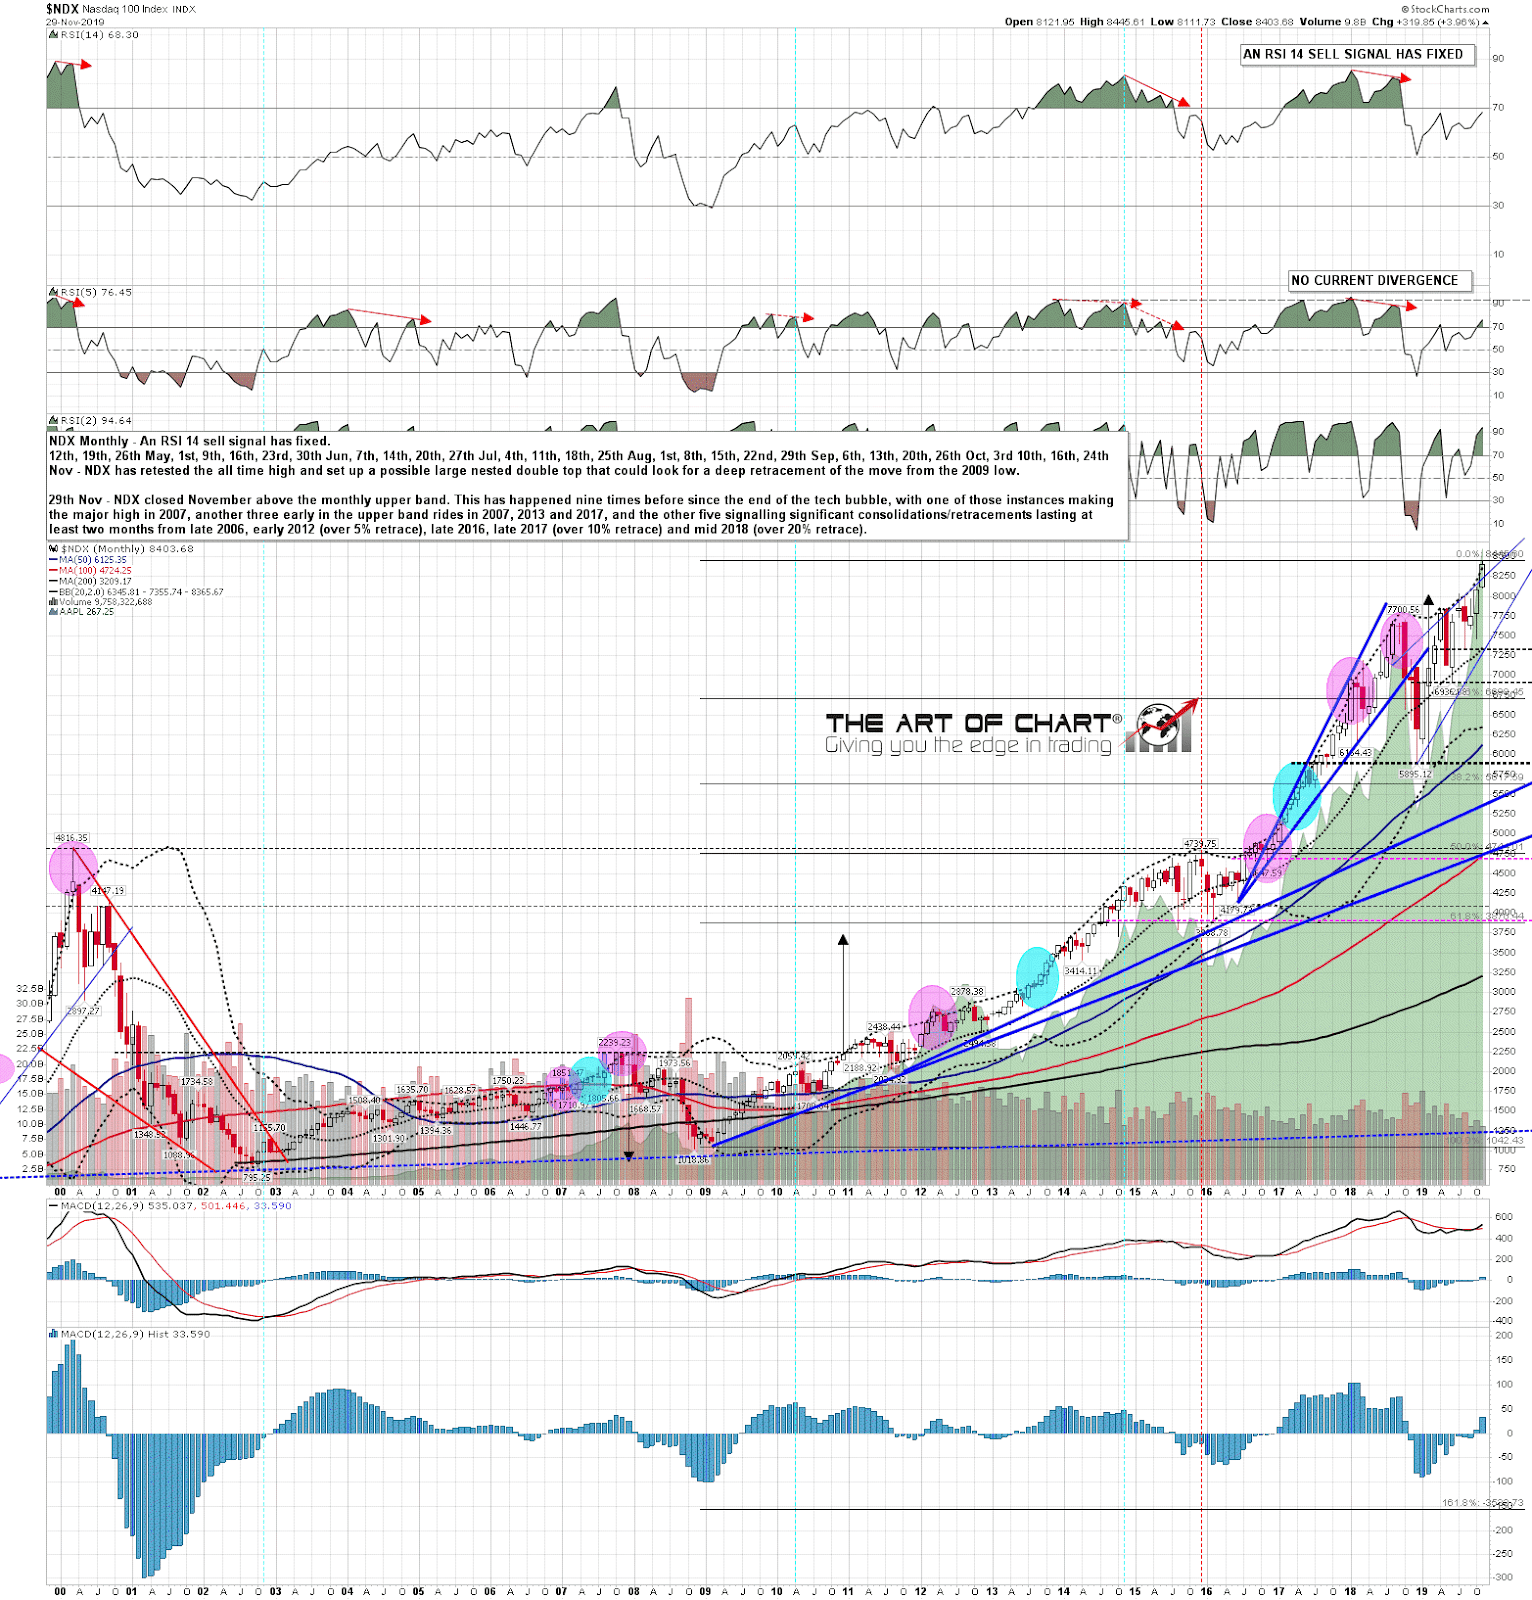
That event was NDX closing clearly above the monthly upper band at the end of November. This is a stat I’ve been watching for a few years now, and this has happened at the end of nine previous months (not within a monthly upper band ride) since the bursting of the tech bubble in 2000. One of those instances was at the major high in 2007. Another three were early in monthly upper band rides in 2007, 2013 and 2017. The remaining five signalled significant multi-month consolidation in late 2006 (consolidation) , early 2012 (over 5% retrace), late 2016 (consolidation), late 2017 (over 10% retrace), and mid 2018 (over 20% retrace). The odds here favor multi-month consolidation or retracement by two thirds, and over 50% in favor of a significant retracement, which would fit with the retracement that we have been talking about from the swing high we have been expecting here.
NDX monthly chart:
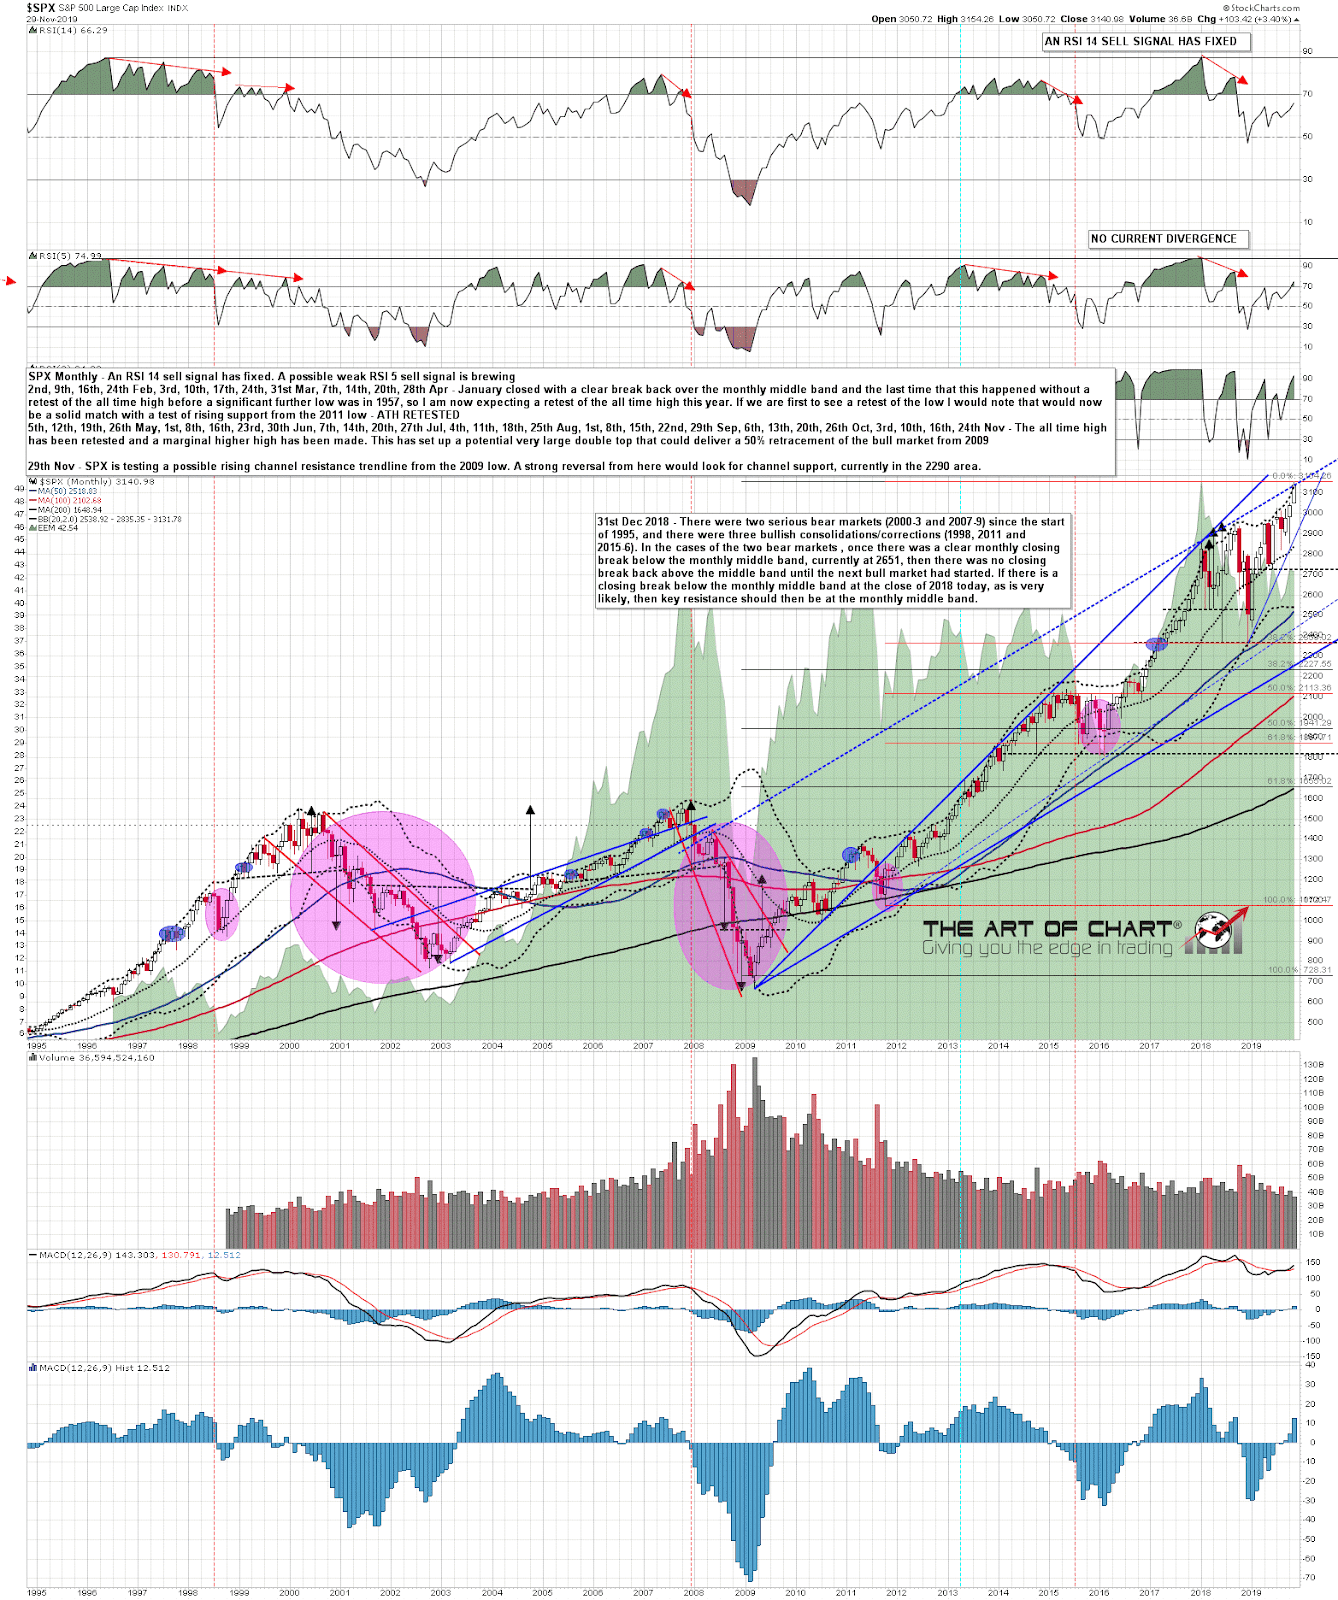
So where might that retracement go? Well on SPX there has also been an interesting development at the high this month, as a decent quality rising channel may now have been established from the 2009 low. If that channel resistance holds and SPX returns to channel support, then that is now just under 2300. I’m wondering whether this retracement might return to retest the December 2018 low at 2346, and perhaps establish a firm floor there, and then return to channel resistance, just tested of course, and rising at about 145 handles per year. That would be an ideal trading scenario here and it might be too much to hope that SPX would give us such an generous gift. Still that scenario will certainly be at the top of my Xmas list for Santa this year. 🙂
SPX monthly chart:
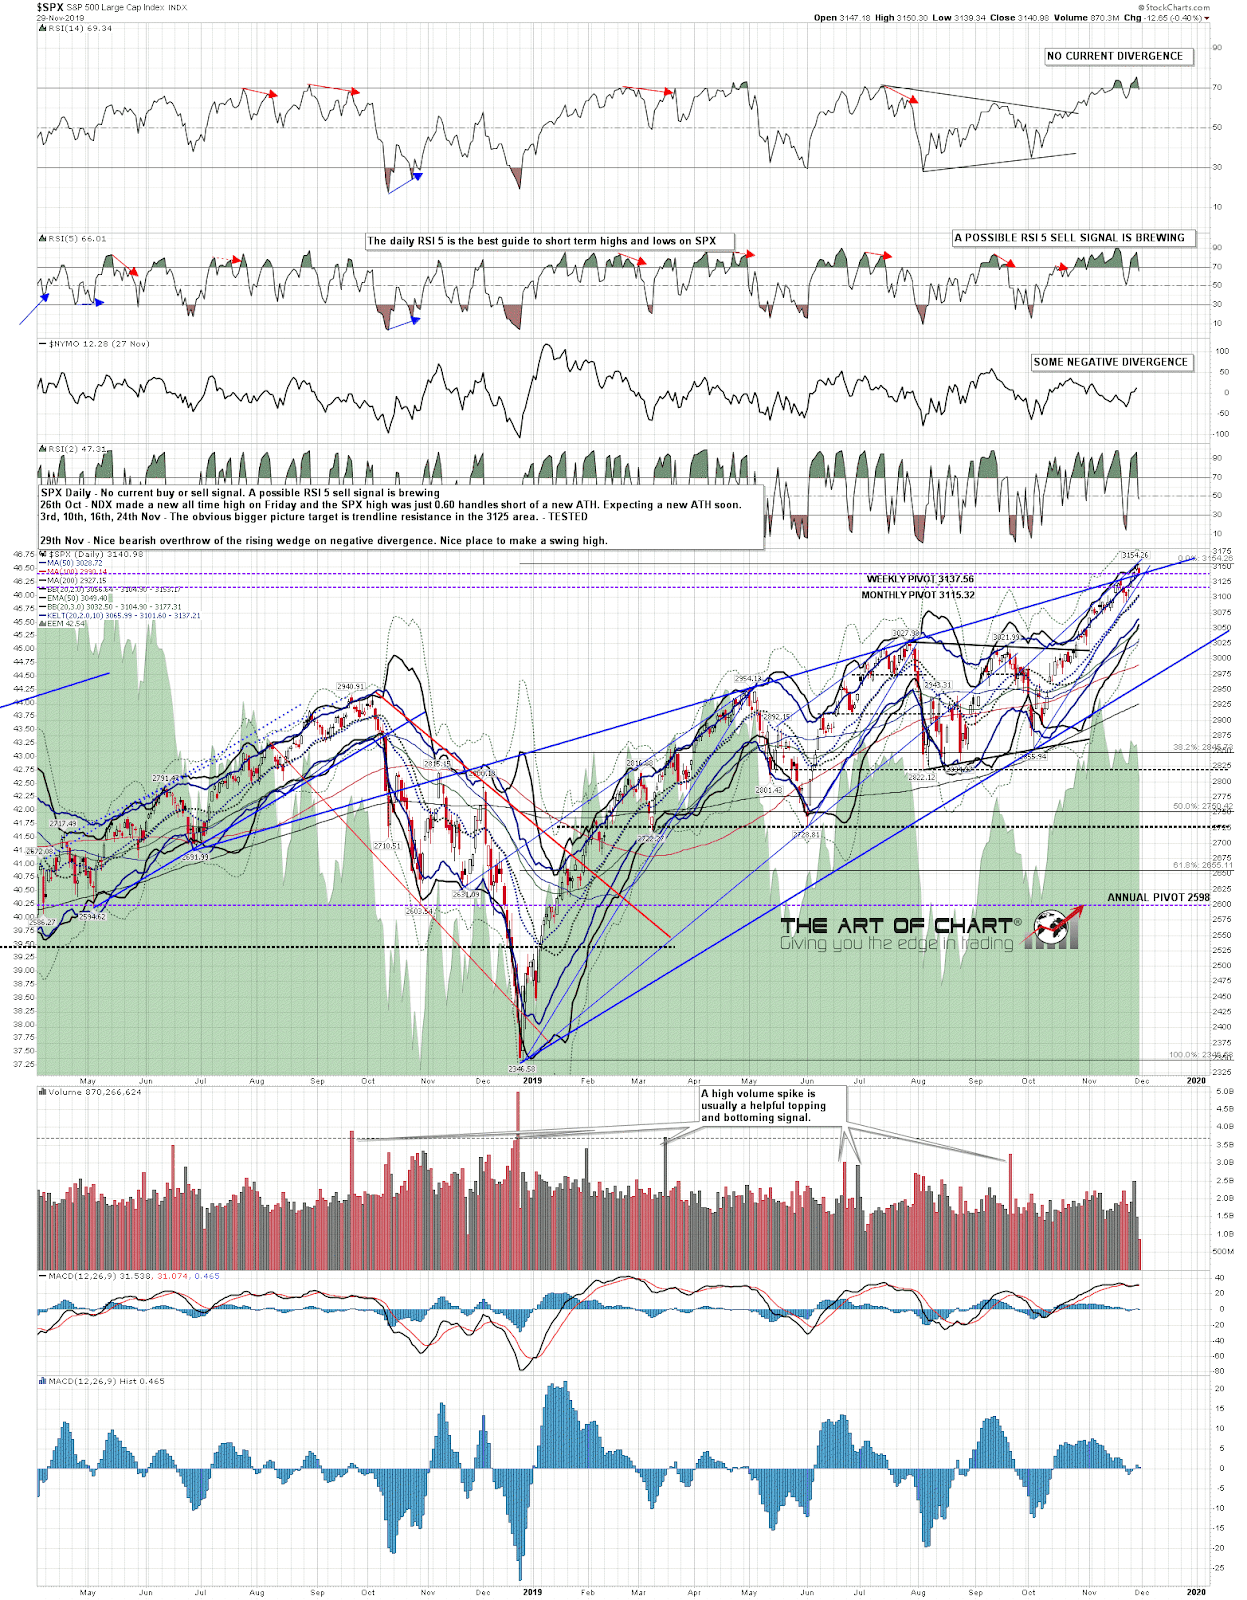
In terms of the shorter term setup on SPX, the trendline that I was looking at in previous posts was the rising wedge resistance trendline from the December low last year and that has been hit and slightly overthrown, which is pretty standard for a rising wedge before it breaks down. That’s looking good to the downside with rising wedge support now in the 2960 area. A high quality RSI 5 / NYMO daily sell signal is now brewing.
SPX daily chart:
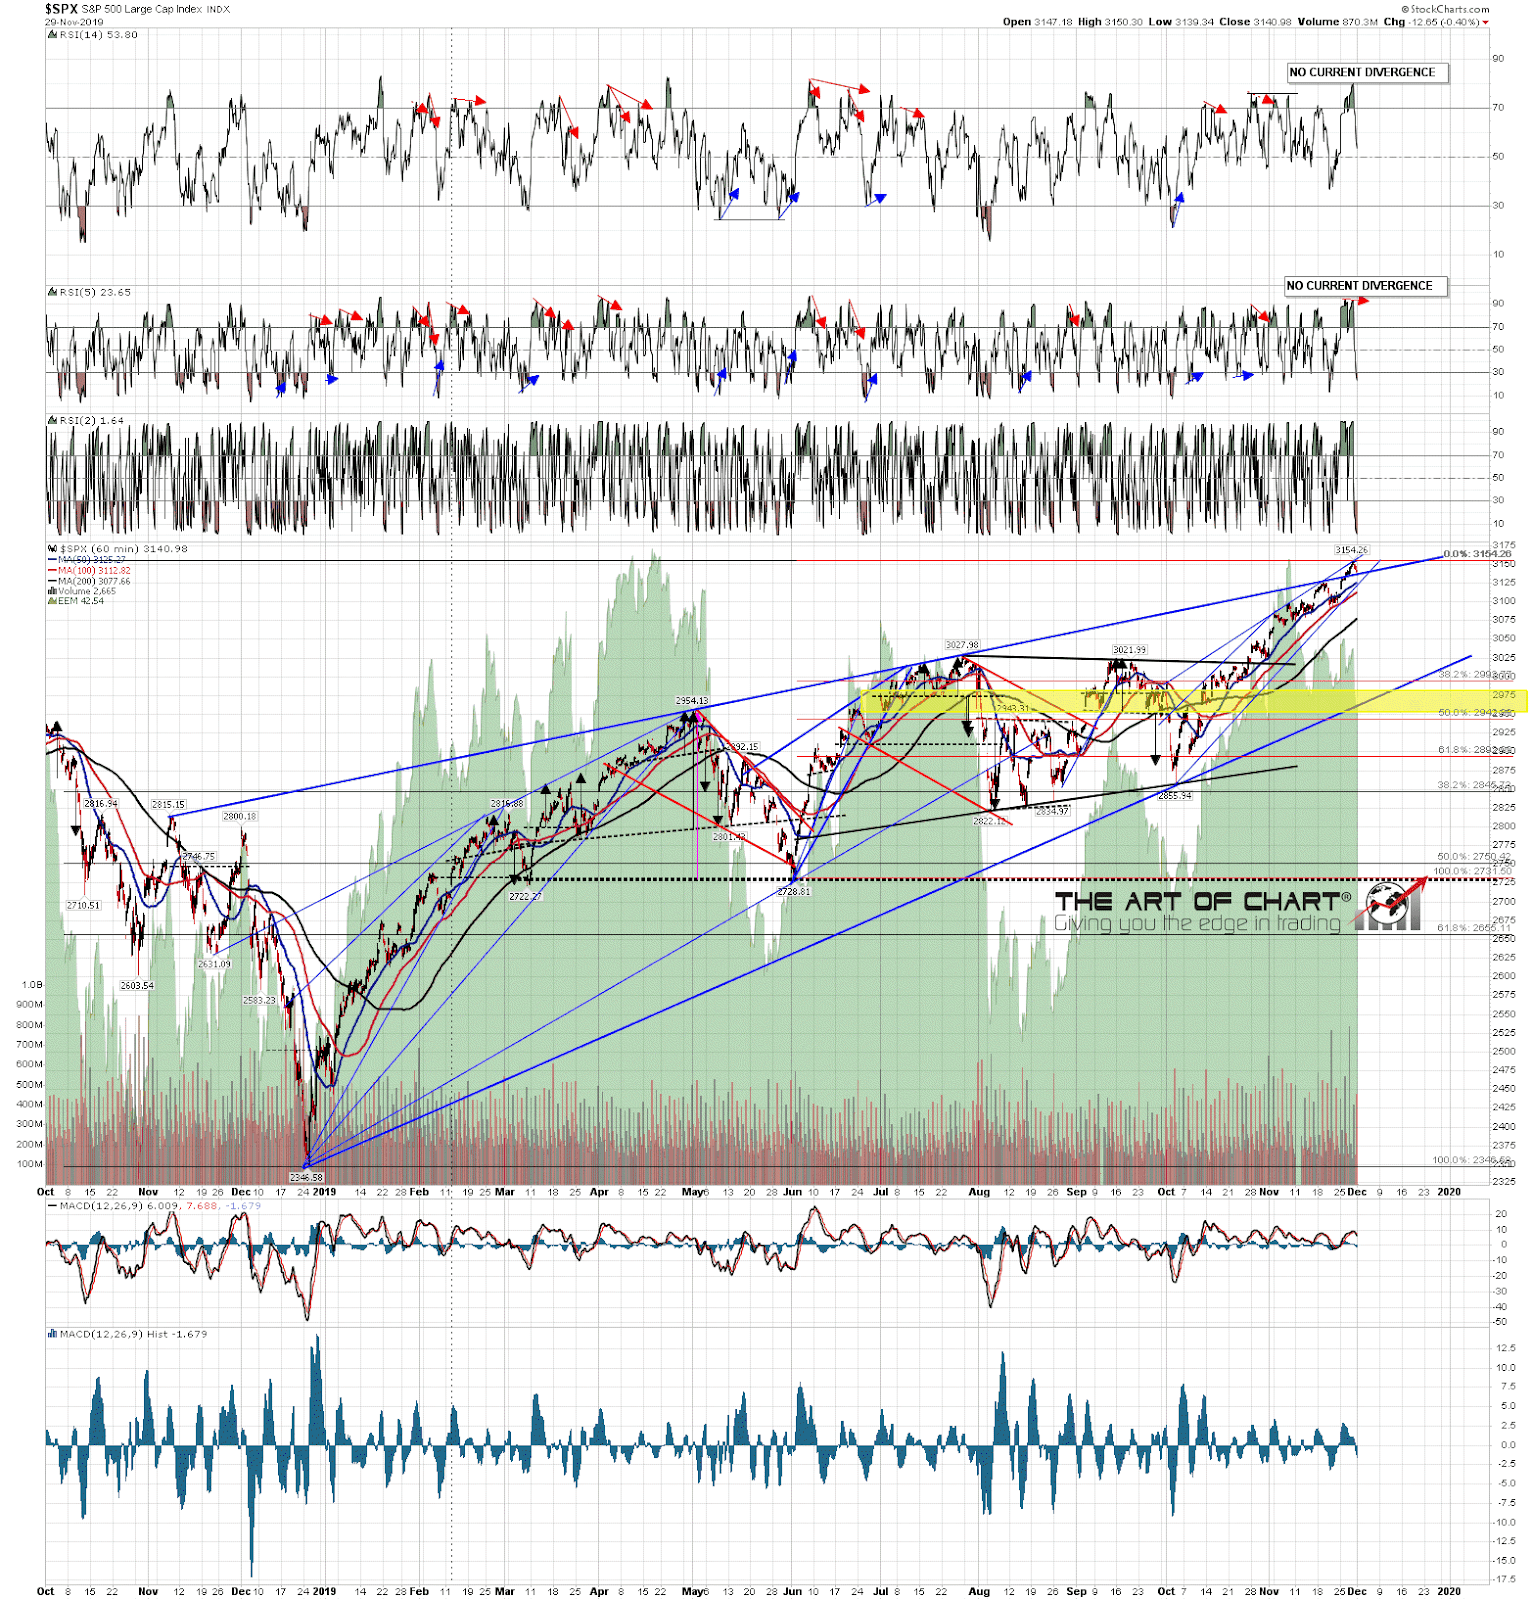
On the hourly chart there is currently no negative divergence on the RSI 14, and that has me wondering about a high retest on Mon/Tues before we see a larger move down to set a possible hourly RSI 14 sell signal brewing. Key short term support is in the 3125 area at the 50 hour MA, which has not been convincingly broken since SPX crossed back above it.
SPX 60min chart:
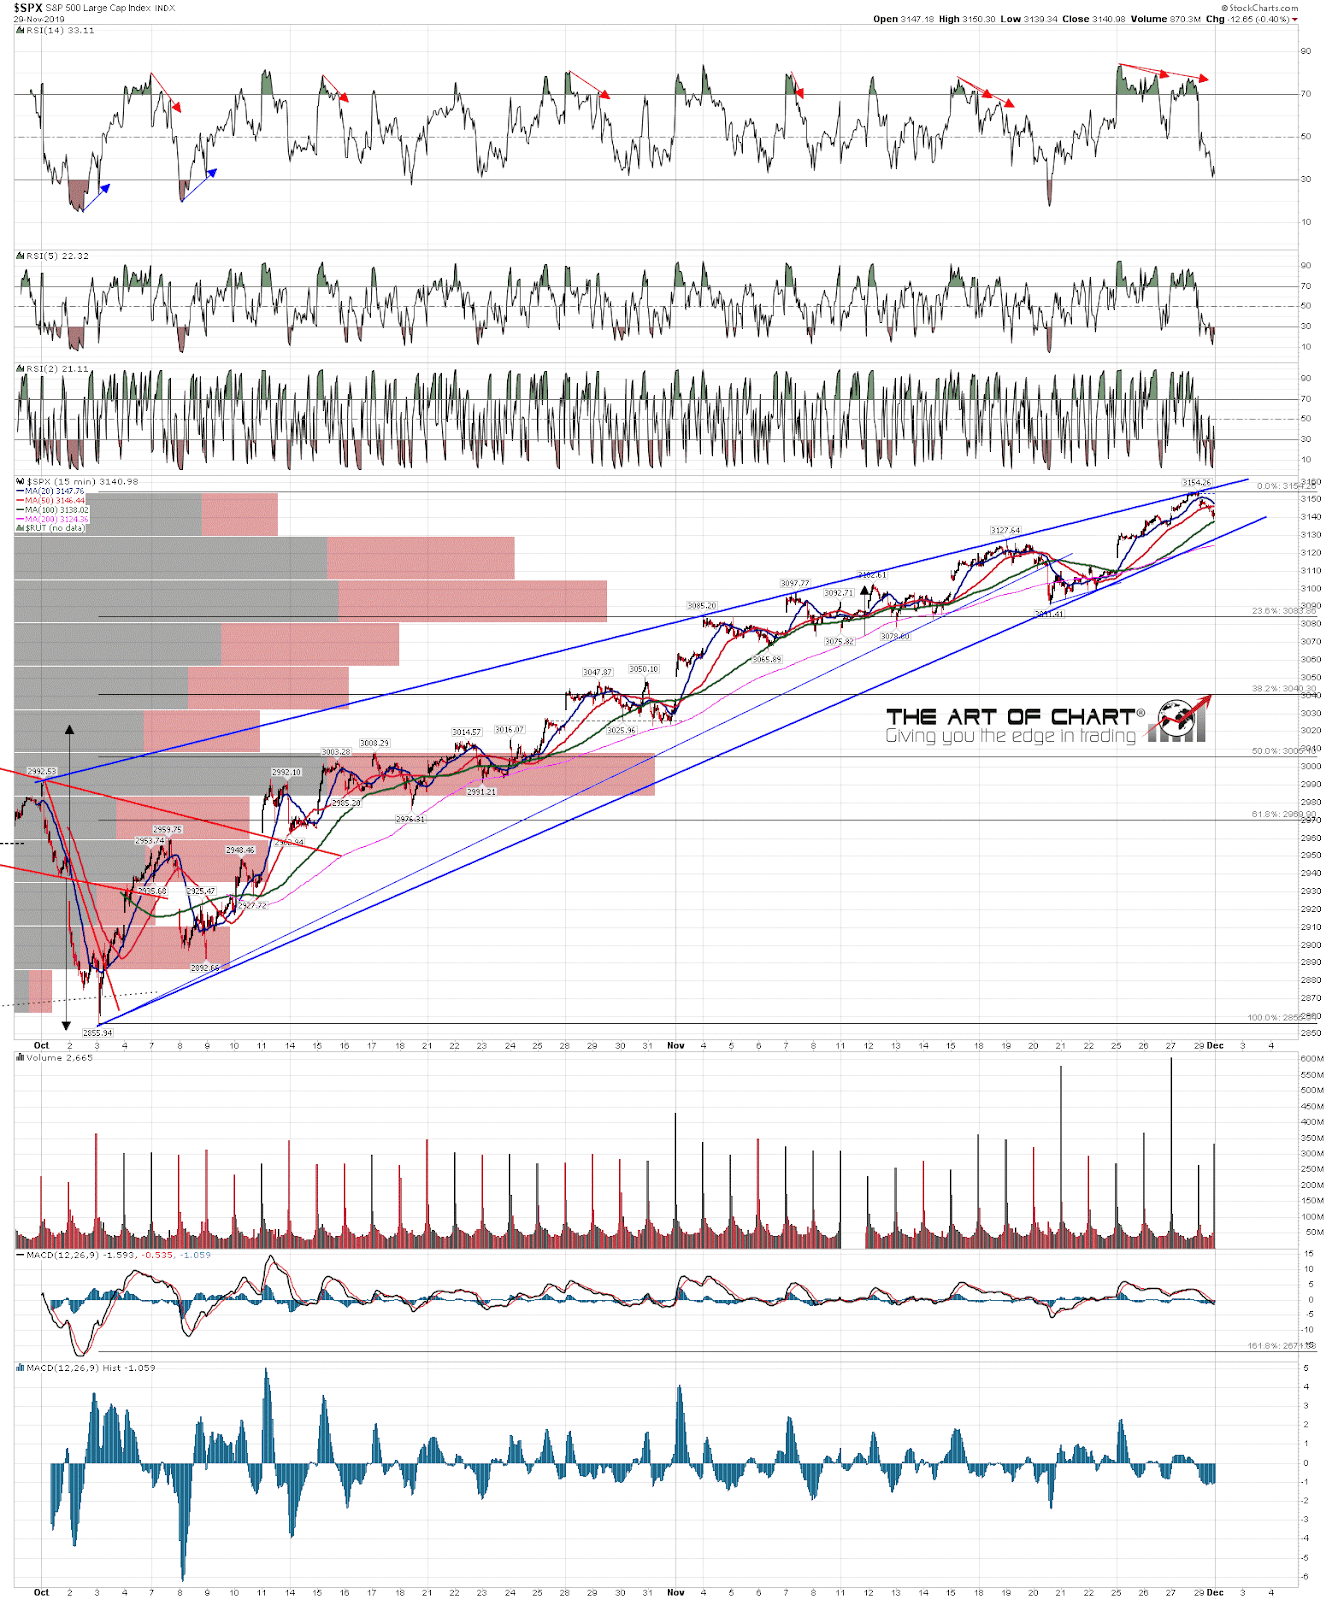
One thing I like to see in a candidate high is a rising wedge within a larger rising wedge, as these are frequently termination patterns. In this case there is a very nice smaller rising wedge from early October and wedge resistance was hit at the high last week. Possible H&S or double top options to go lower depending on the high tomorrow, and this shorter term rising wedge support is currently in the 3128 area.
SPX 15min chart:
A couple of announcements today. The first is that we are running our annual Black Friday sale on annual memberships at theartofchart.net, which as well as the usual two free months on an annual membership is an additional 20% off. That is running until the close on Friday 6th December and if you are interested, you can find the link for that here.
The second is to mention that our next monthly free public Chart Chat is in a week on Sunday 8th December. If you’d like to attend we will be covering the usual very wide range of instruments and you can register for that on our December Free Webinars page.
 01st Dec 2019
looks and sounds like you make a good case for SPX turning very soon. looking at these charts and your post, it appears to me you have a good catch here. Nice work