Following on from my post last week about the coronavirus COVID-19 here, we are now seeing some genuine coronavirus numbers coming through, and the numbers at the weekend weren’t great so equity markets are down this morning in response. How bad was the news? Here are this morning’s numbers:
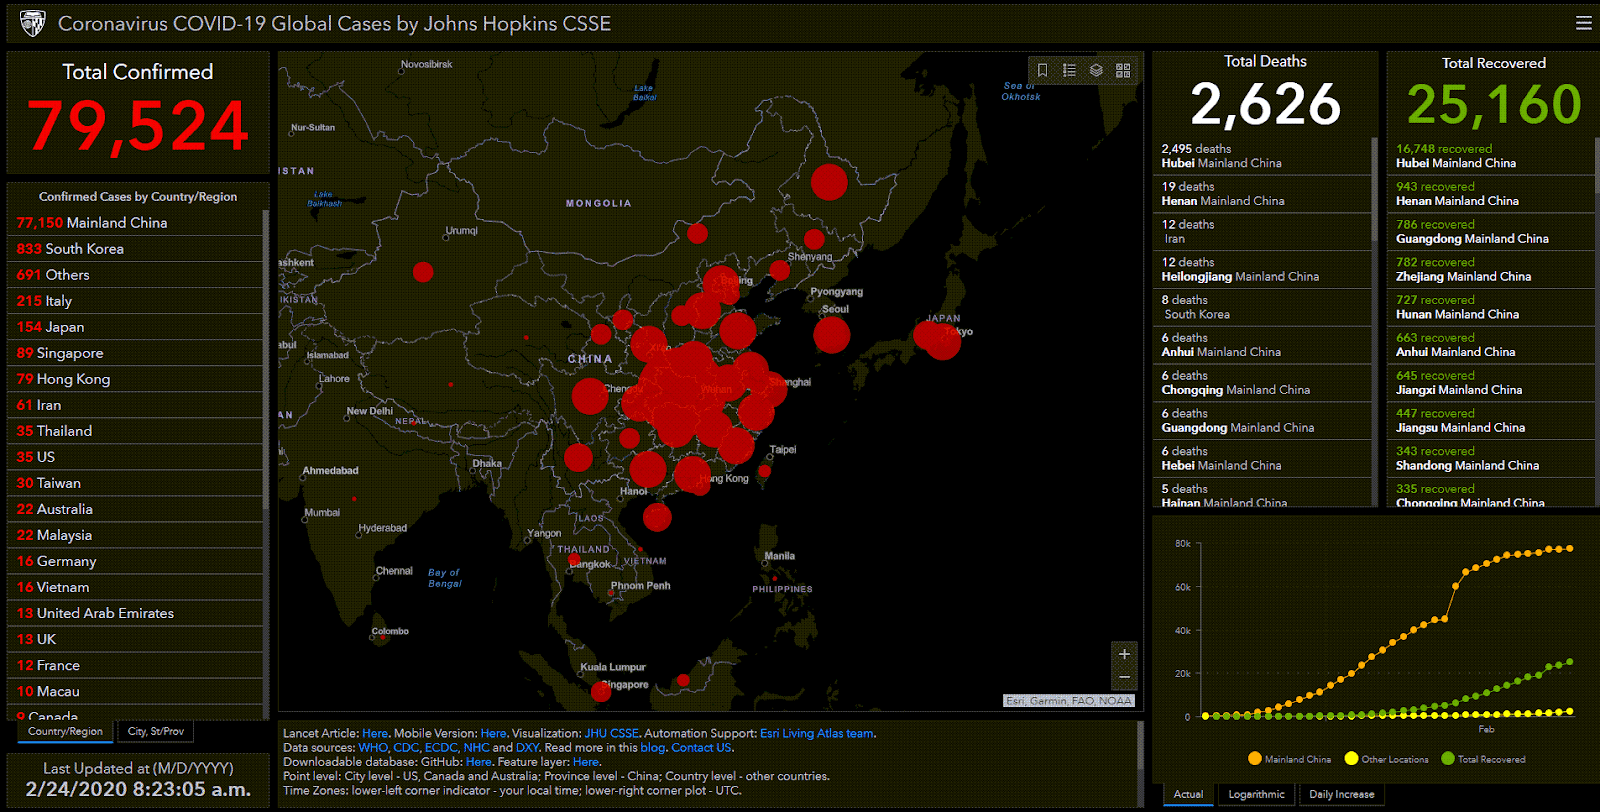
Honestly these numbers are not too bad so far in my opinion. There are serious outbreaks now in South Korea and Italy, but excluding the very dubious quality China numbers, not many deaths so far and there is not much to say as yet that the virus is likely to become a global pandemic like the Spanish Flu pandemic in 1918/9 that wiped out between 2% to 5% of the world population at the time. You can read about that here. If this does happen then obviously markets worldwide will be seriously affected, and this morning’s gap down would likely just be a taste of what is to come, but if the virus is contained over the next few weeks then we should see a significant decline here and very possibly drop the 20% required to qualify as a bear market, but at that point there would likely be a buy opportunity and much or all of that decline might then be recovered over the rest of 2020. We’ll see
One thing that I have found very strange watching all this though is the general cluelessness and lack of preparation of governments worldwide in response to this outbreak, which if it does break out to become a global pandemic will be perhaps the most predictable natural disaster in human history. I was reading back in the 1980s, in The Economist I think, about Spanish flu as just one of a series of superflu pandemics that have broken out over the course of human history, and about the likelihood that it was just a matter of time before the next one broke out, most likely having originated in China, into a worldwide pandemic that could kill 2%+ of the world population, and possibly more than 10%. I’ve been reading about this likelihood regularly since. I had perhaps naively assumed that the US particularly would have wargamed this scenario extensively, and that steps would have been taken to try to avoid a worldwide pandemic in the event that a strong superflu candidate emerged. It seems that was not the case.
In the US I was reading at the weekend, and I hope that it wasn’t true, that only two US states have any COVID-19 testing kits, which are in any case rather hit and miss with a lot of false negatives, and that the only people tested so far have been those in contact with recent arrivals from China. If true, that means that the US have no real idea whether they have a problem yet, and the first confirmation of an outbreak might be a lot of dead and dying Americans. This is, to say the least, somewhat disappointing, and suggests that if COVID-19 doesn’t become a worldwide pandemic, that will only be because it wasn’t virulent enough, and that when there is another that is virulent enough, years or decades from now, then it will follow a natural progress unimpeded by any kind of planned intervention by governments:

That said, on to the markets and I’ll start by posting the premarket video that I recorded this morning looking at the declines so far and important levels to watch. If you’re just interested in equity markets then those are at the start and if you haven’t seen one of these before, the instruments covered in the video are SPX, ES, NDX, NQ, INDU, YM, RTH, DAX, ESTX50, CL, NQ, GC, SI, HG, ZB, DX, EURUSD, USDJPY, USDCAD, AUDUSD, KC, SB, CC, ZW, ZC, ZS and LH. Mostly futures and forex with a look at the RTH index charts and TNX for bond yields:
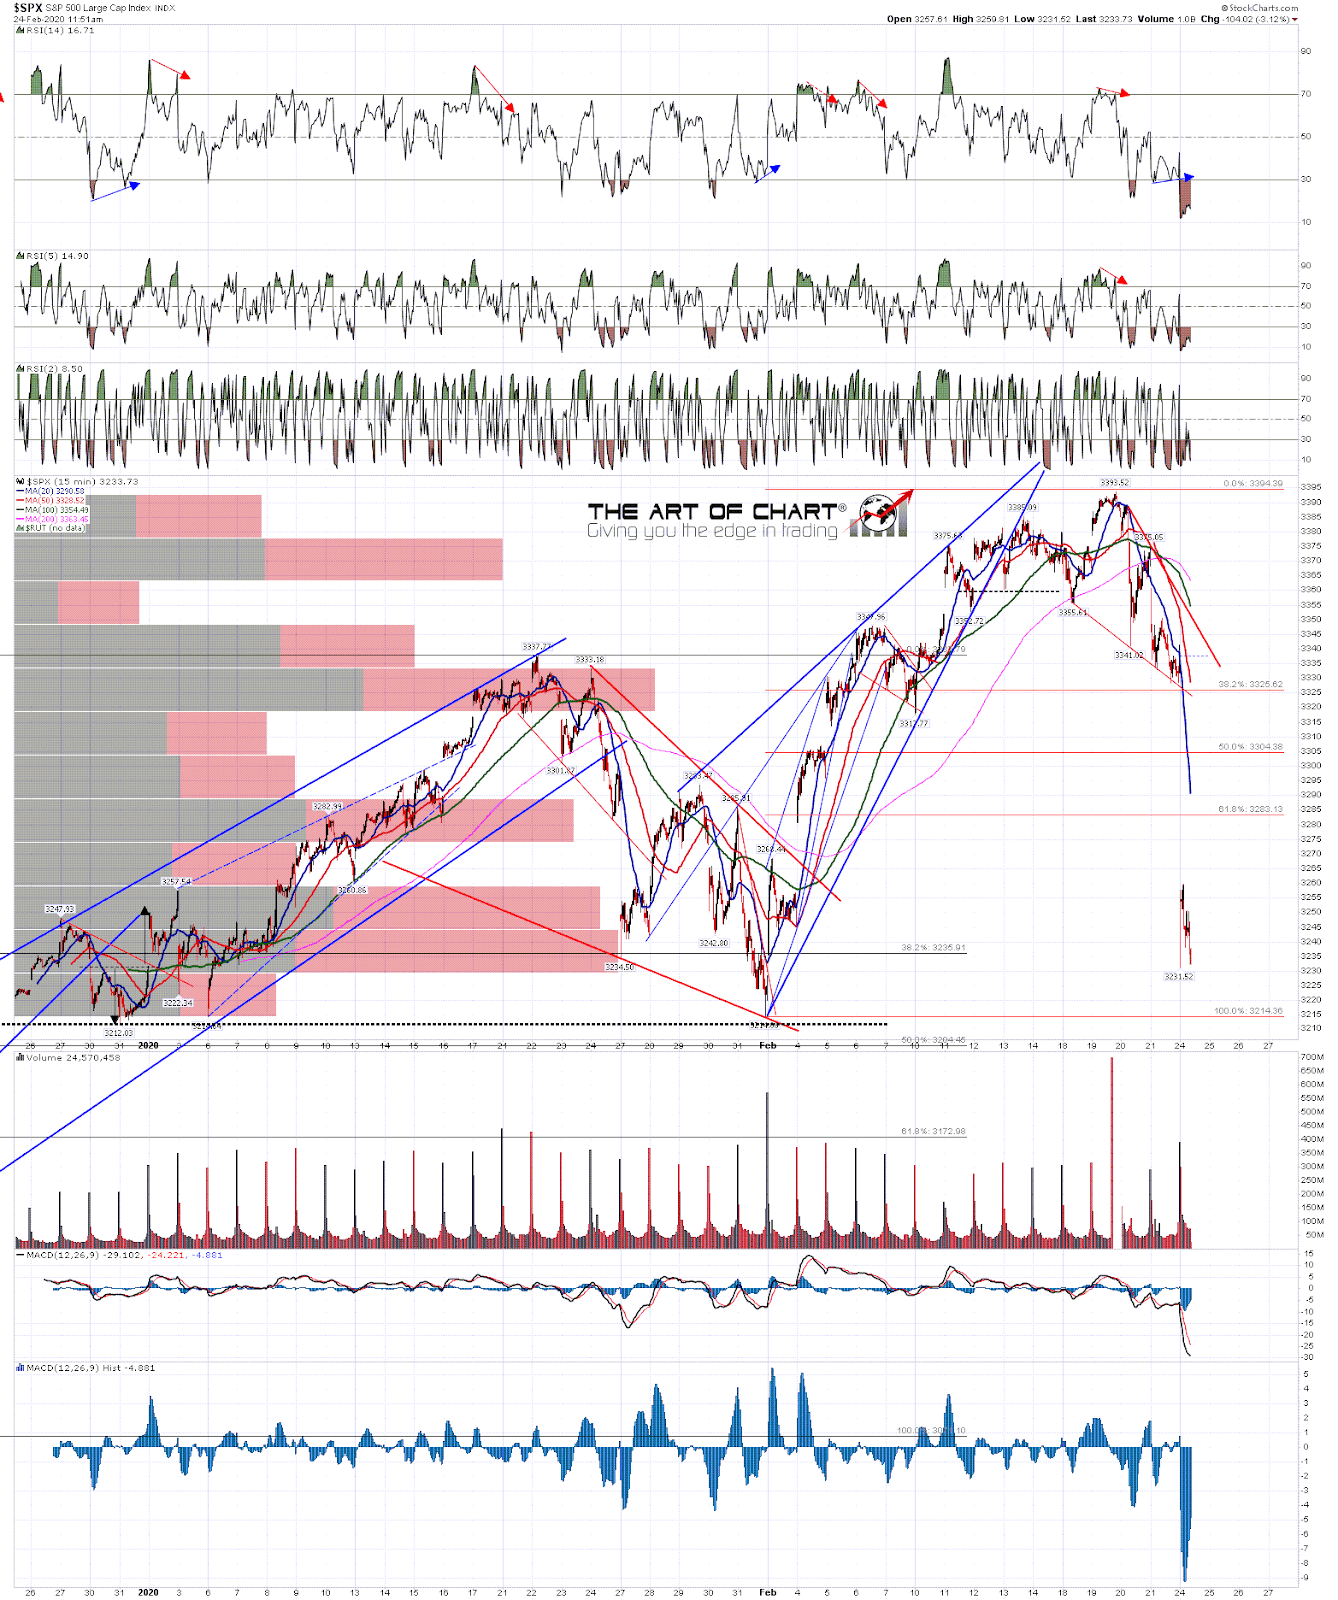
In the short term the rising wedge on the SPX 15min chart has an obvious target at a retest of the early Feb low at 3214.36. That is a possible H&S neckline so would be a decent candidate for a strong bounce from there.
SPX 15min chart:
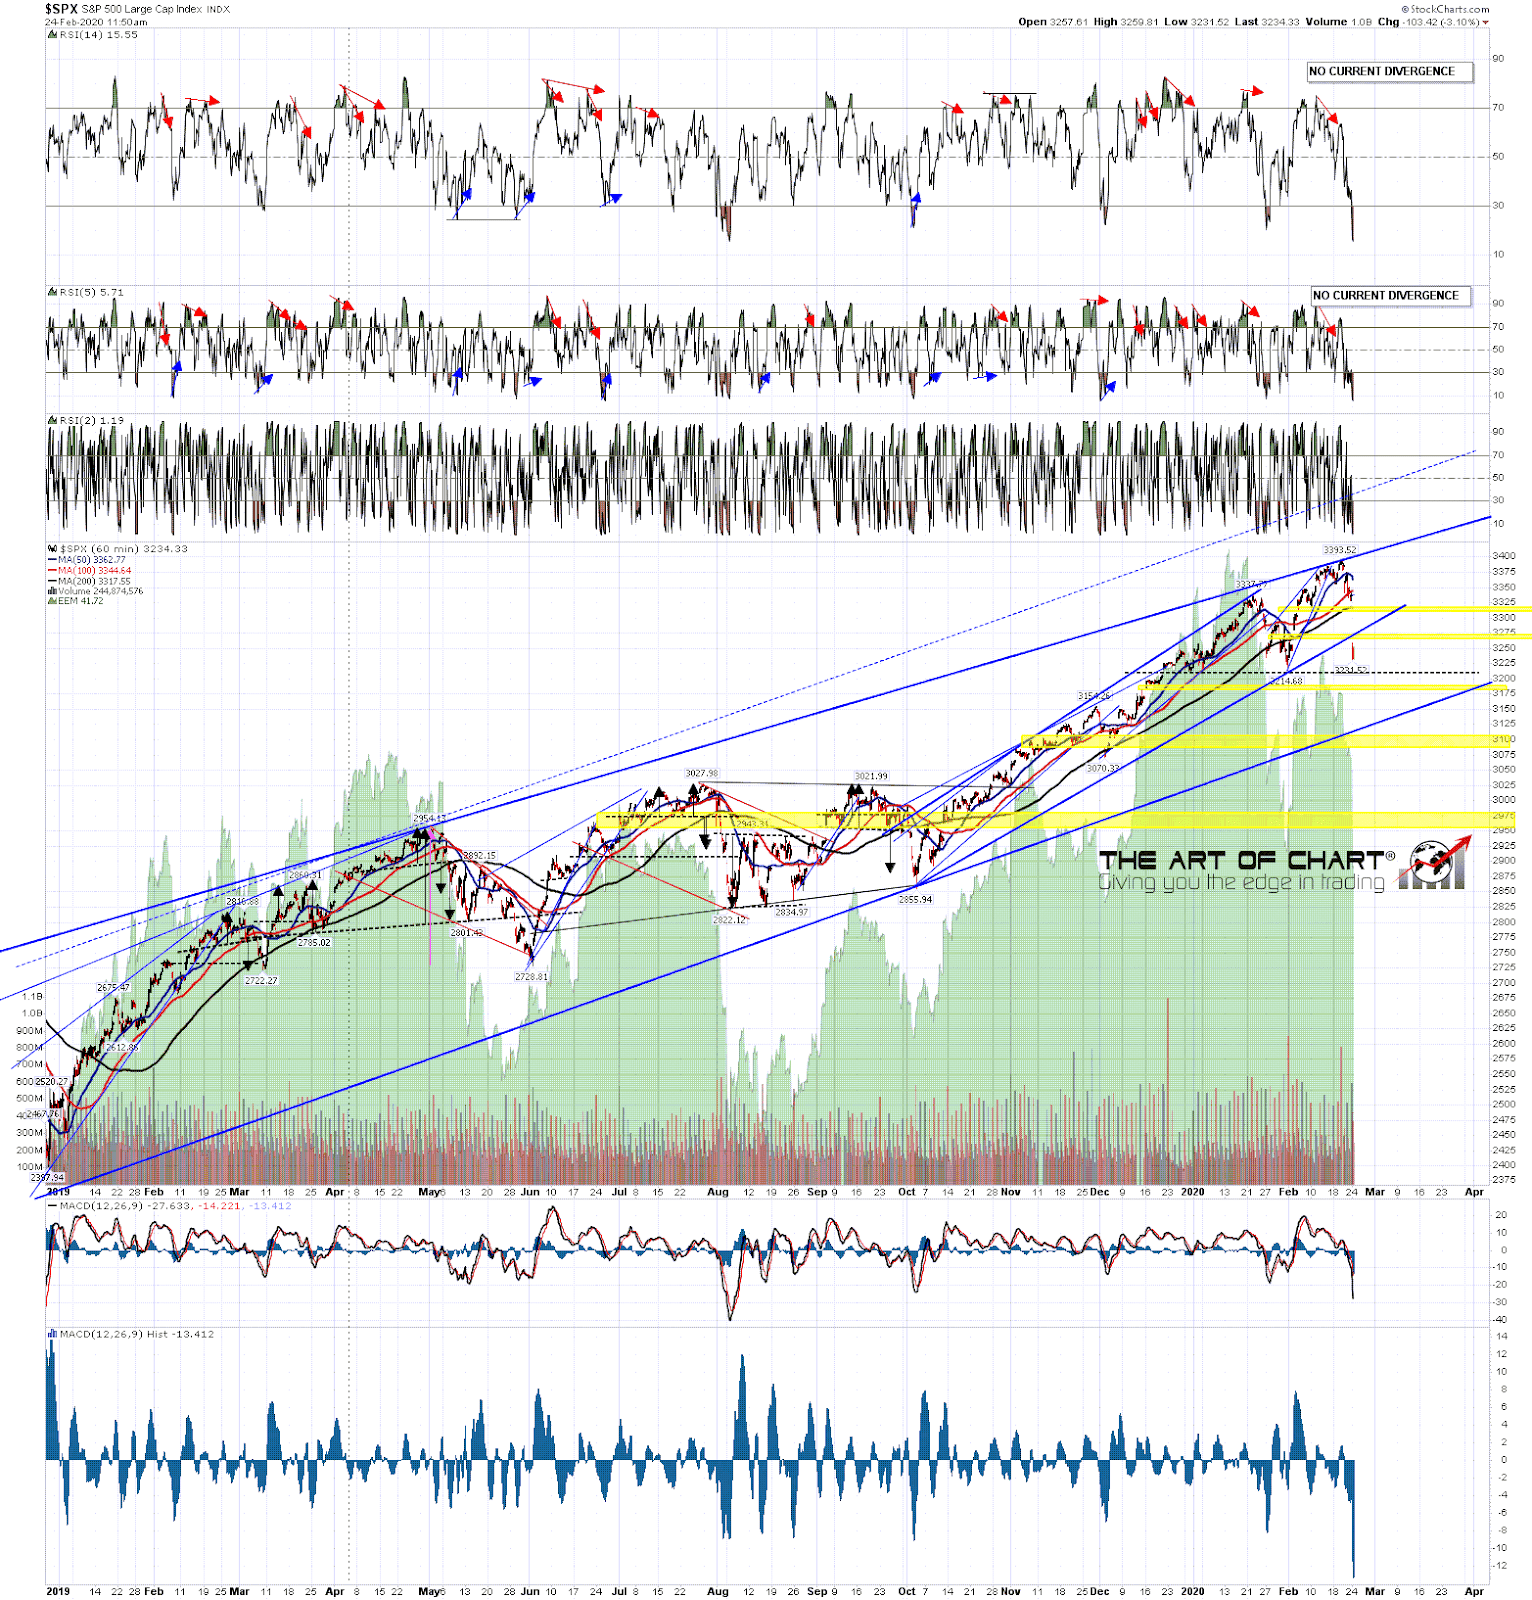
On the SPX 60min chart the hourly sell signals have reached target and there is no current positive divergence. SPX gapped down through the rising megaphone support from the October low and that opens the next obvious big rising support trendline target currently in the 3110 area. That is the rising support trendline from the December 2018 low, and is a solid target for this move if SPX goes through the 3124 area with confidence. If we do see a bounce in the (roughly) 3214 area to make an H&S right shoulder, then that ideal right shoulder high would be in the 3337 area. SPX 60min chart:
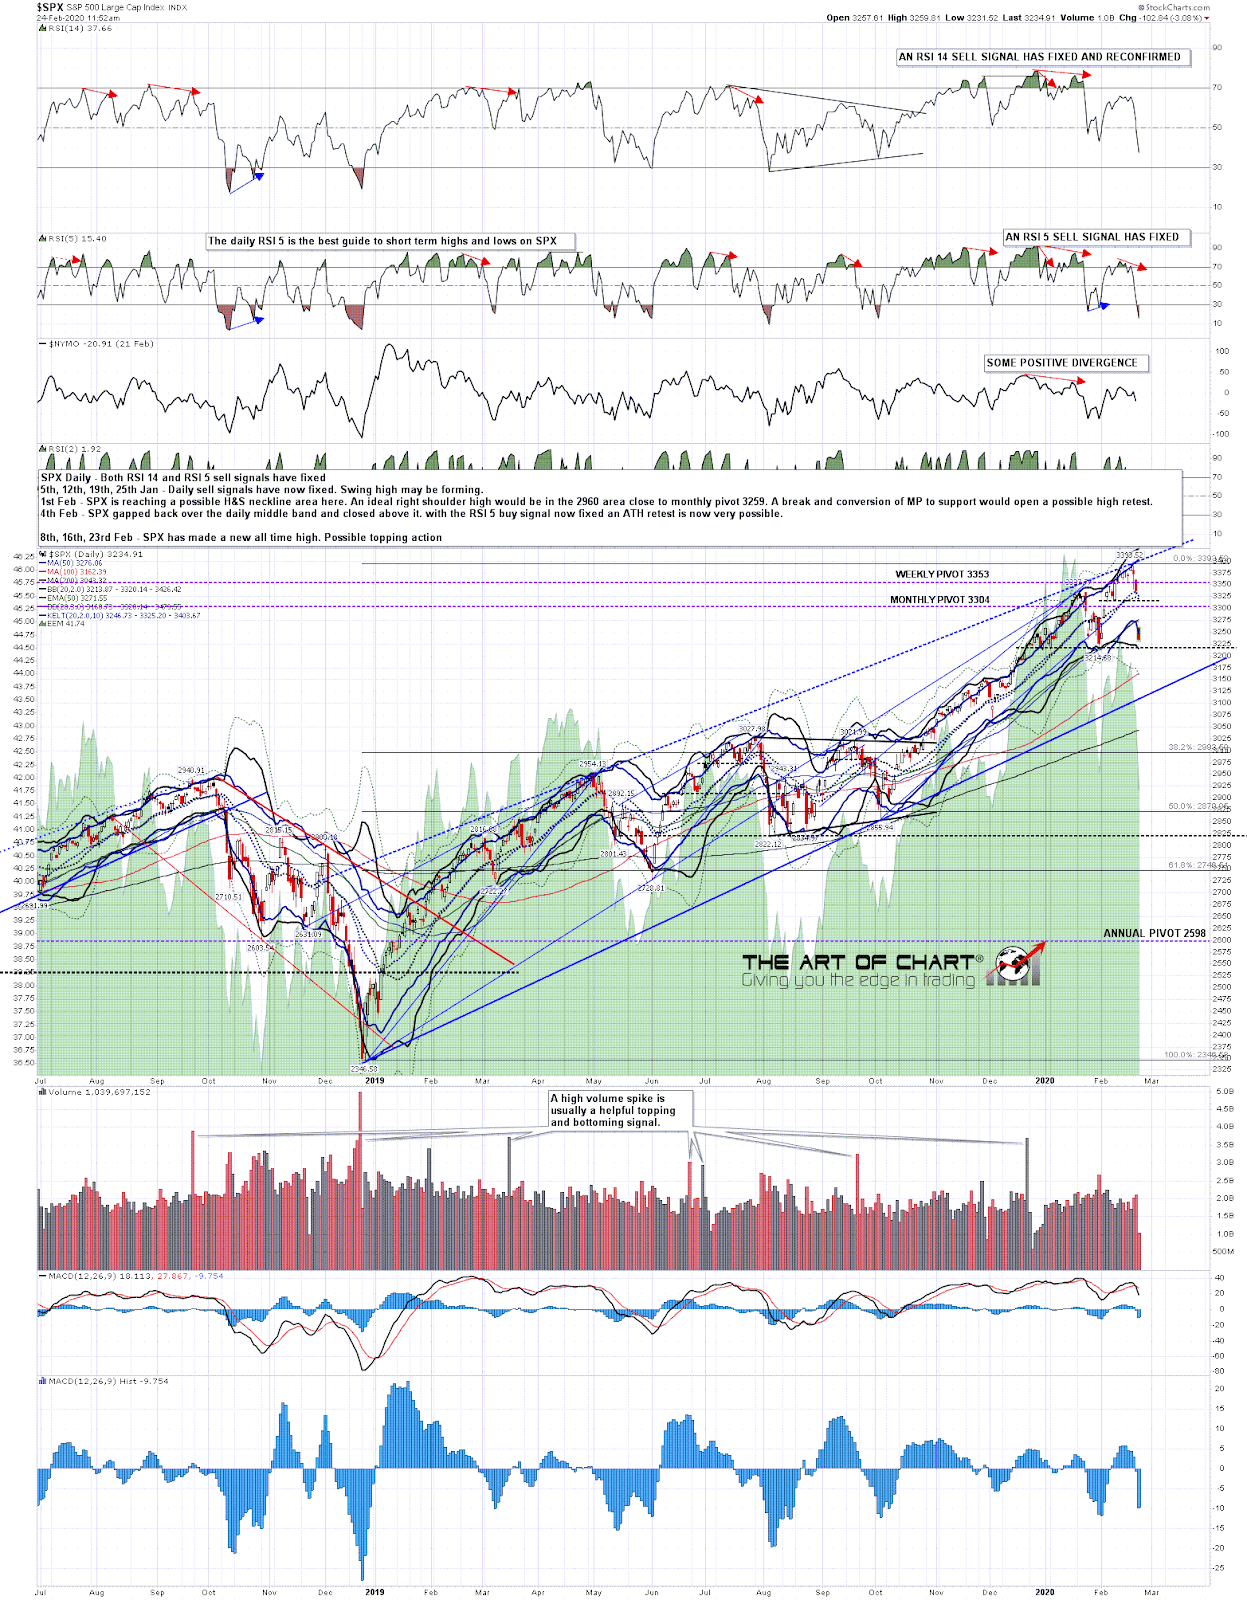
If SPX was to deliver that strong right shoulder rally then the likely target area would be the daily middle band area, with the daily middle band closing in the 3325 area on Friday and still rising for the moment. With a strong gap below the daily middle band at the open this morning that is now important resistance that may well get a test on a decent rally. The daily RSI 5 sell signal has reached target but the daily RSI 14 sell signal still has some way to go yet. SPX daily chart:
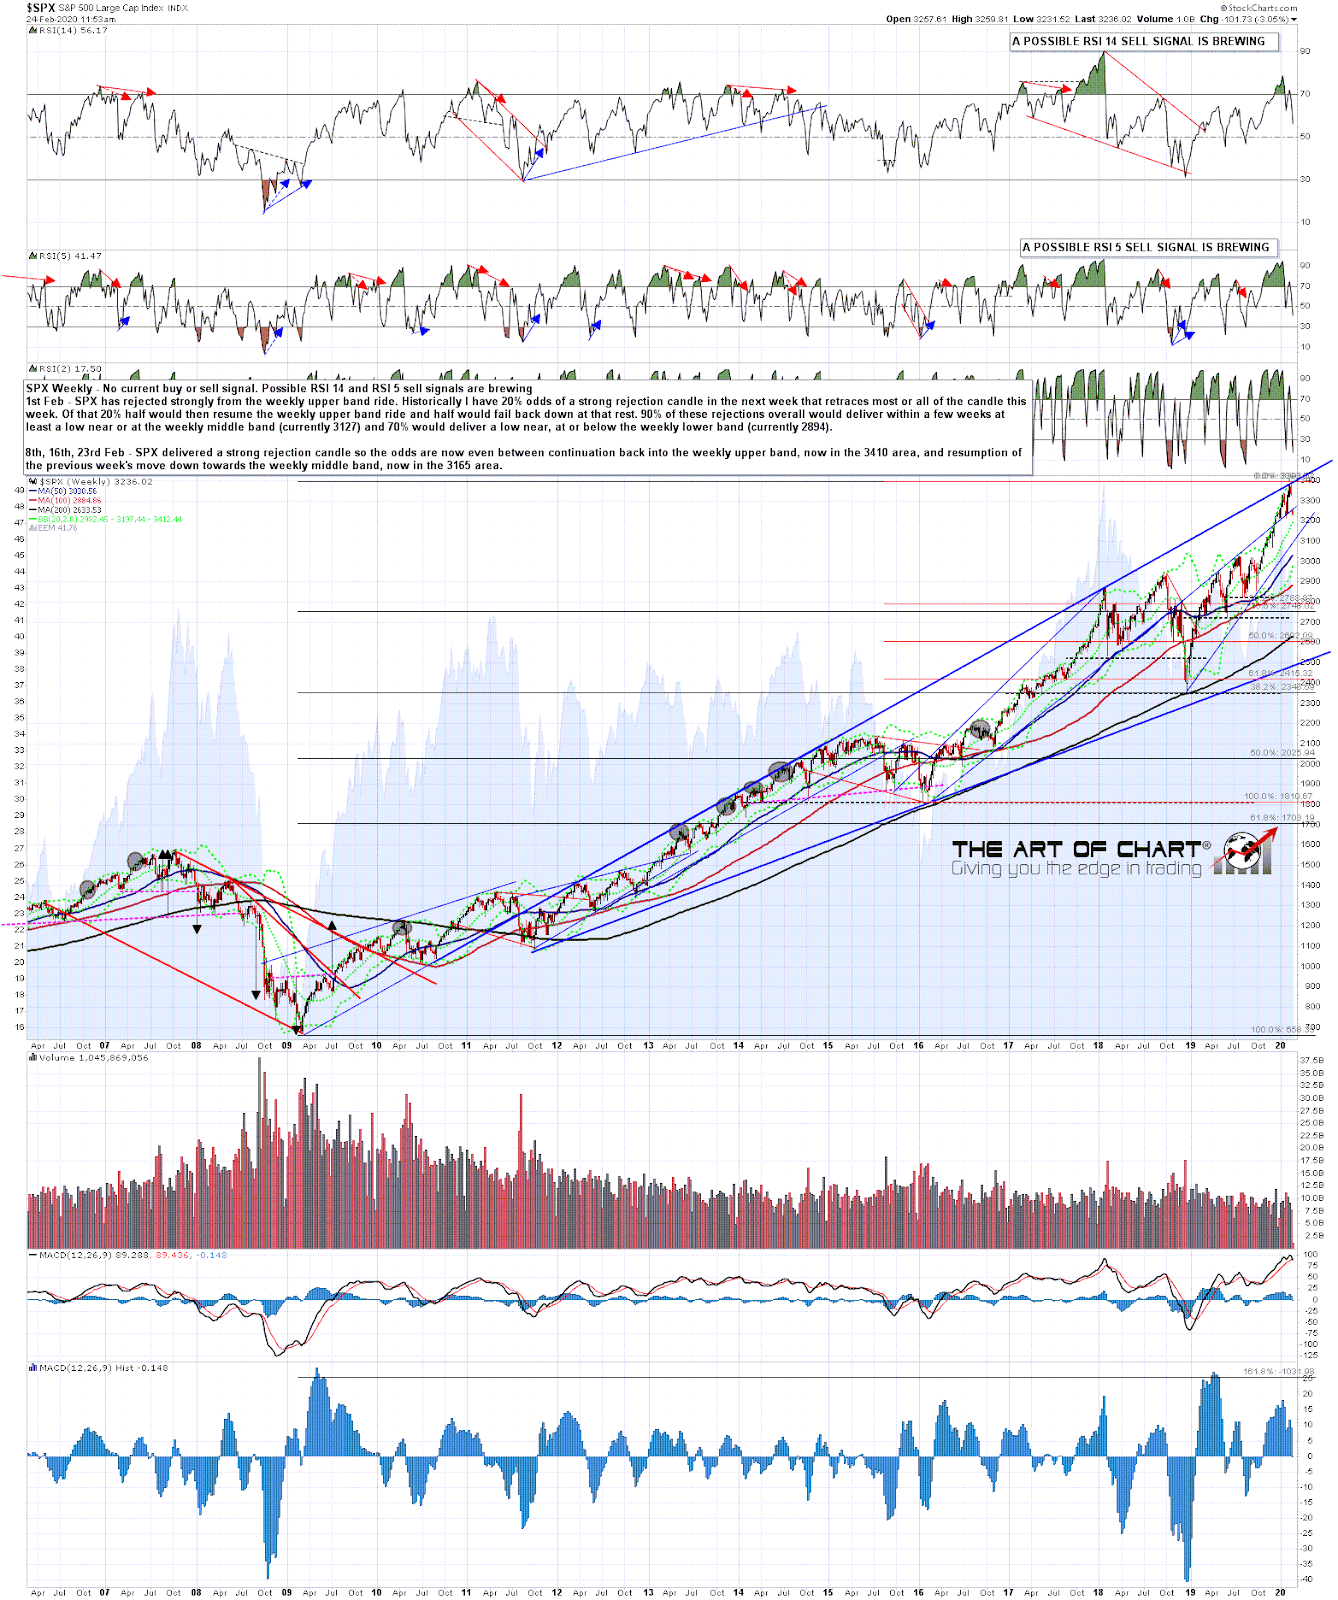
So where might this be going on the bigger picture? Well the last high gave SPX possible weekly sell signals brewing and if we close the week in this area those would fix. A break below trendline support in the 3100 area would then open a possible test of the very decent quality rising megaphone support from the 2011 low, currently in the 2500 area. That would be an ideal target to reach and find support and, if seen, could deliver a major buying opportunity later this year. We shall see. SPX weekly chart:
In summary the coronavirus news so far isn’t too bad so far, but will likely get worse before it gets better. Equity markets too will likely go lower before there is any decent buy opportunity here, but we’ll have to see how this develops in terms of reversal patterns particularly to give form to this decline, and give us clues as to where this is likely to be headed. We’ll see how that develops. If you’d like to hear Stan and I analysing this increasingly interesting market on a daily basis you could sign up for a 30 day free trial at theartofchart.net on this page here. That gives you access to most of our analysis and particularly our subscriber only twitter feed where we post our intraday updates and targets. The trial is free for 30 days, at the end of which you can either cancel with no obligation or subscribe to one of our services.
 24th Feb 2020