I’ve been mentioning that TF/RUT has been forming some kind of bull flag that should deliver a retest of the all time highs on TF/RUT, and that bull flag is a clear falling megaphone flag on RUT that underthrew bullishly yesterday morning and broke up this morning with a minimum target at a retest of the all time high on RUT at 1514.94. The all time high on TF was made outside RTH and is slightly higher in the 1518.40 area. I’d expect both to be tested before any serious reversal. RUT 60min chart:

SPX is forming a decent quality rising wedge and the obvious read for yesterday’s near miss of the wedge support trendline is that the trendline should be tested again soon, and would likely break on that test. However the slight overthrow of the wedge resistance trendline could mean that an alternate slightly higher trendline is forming. If seen that would currently be in the 2580 area. SPX 60min chart:

The ES, NQ and TF futures charts below were done an hour before the RTH open for Daily Video Service subscribers at theartofchart.net. If you are interested in trying our services a 30 day free trial is available here.
On ES I was expecting at least a retest of the new all time high made overnight today and we’ve seen that today. A possible 60min sell signal is now brewing on ES. ES Dec 60min chart:

On NQ I was expecting a retest of the all time high and we haven’t seen that yet, but the action this afternoon looks like a bull flag forming, so that should happen sometime in the next trading day or so. NQ Dec 60min chart:
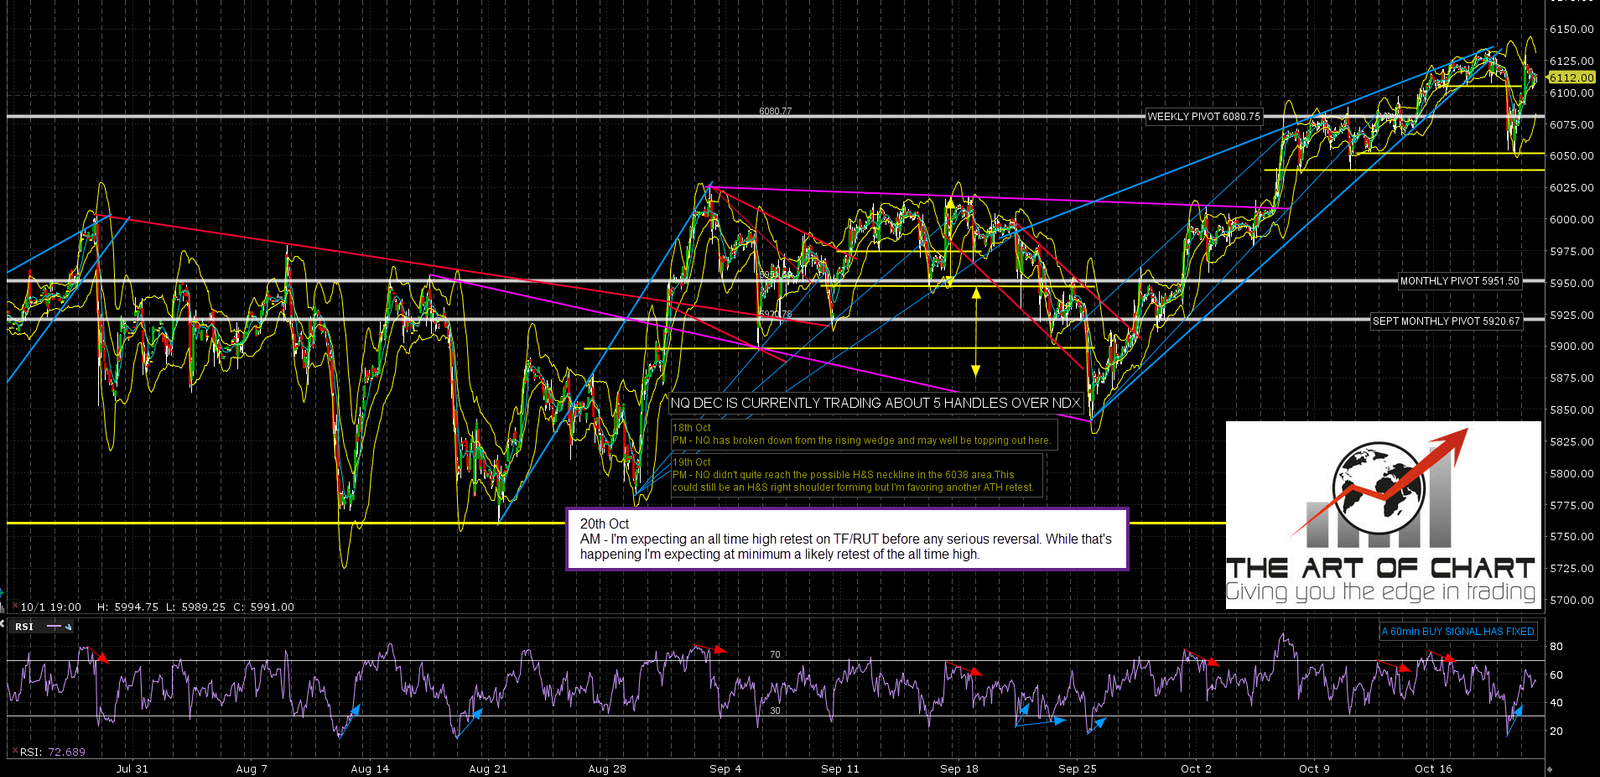
No all time high retest today on RUT or TF but it’s a reasonable expectation that we will see both in the near future. TF Dec 60min chart:

So what happens when these last little upside targets are made? I’m expecting a retracement to start shortly afterwards. Trendline resistance on SPX is suggesting strongly that a high made before close of business on Monday would likely be under 2585. An extension in time beyond Monday has that trendline rising by about two handles per day and my working assumption would be that the swing high would by made on Wednesday at the latest.
How far will that retracement get? We’ll have to see. Everyone have a great weekend. 🙂
 20th Oct 2017