Surprisingly interesting action on SPX/ES today and the possible 2017 highs on SPX and NDX that Stan and I are looking for in the next three or four days may already be in. Intraday Video – Update on ES, NQ, and TF:
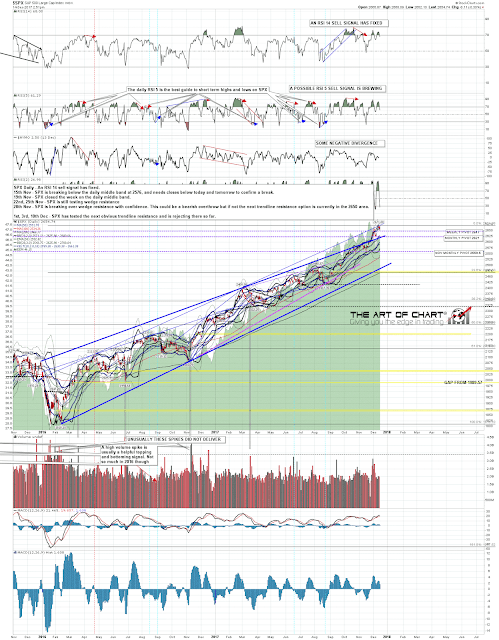
On the SPX daily chart, the resistance trendline from 2016 is holding so far and a strong RSI 5 / NYMO daily sell signal may fix at the close today if we don’t see a significant rally before the close. SPX daily chart:
Stan and I are doing a free public webinar tonight looking at AAPL, AMZN, FB, NFLX, TSLA, and six assorted sector stocks an hour after the close tonight. If you’d like to see it, you can register for that here.

 14th Dec 2017