Back to back reversal trend days, which we haven’t seen in a while, and NQ has now made the new ATH that Stan and I were looking for. My video was moved from premarket to just before midday this morning, as a big Windows 10 update took my media computer hostage for several hours and I had to wait for that to finish. Here is the section on ES, SPX, NQ, and TF. Intraday Video – Update on ES, NQ, and TF:
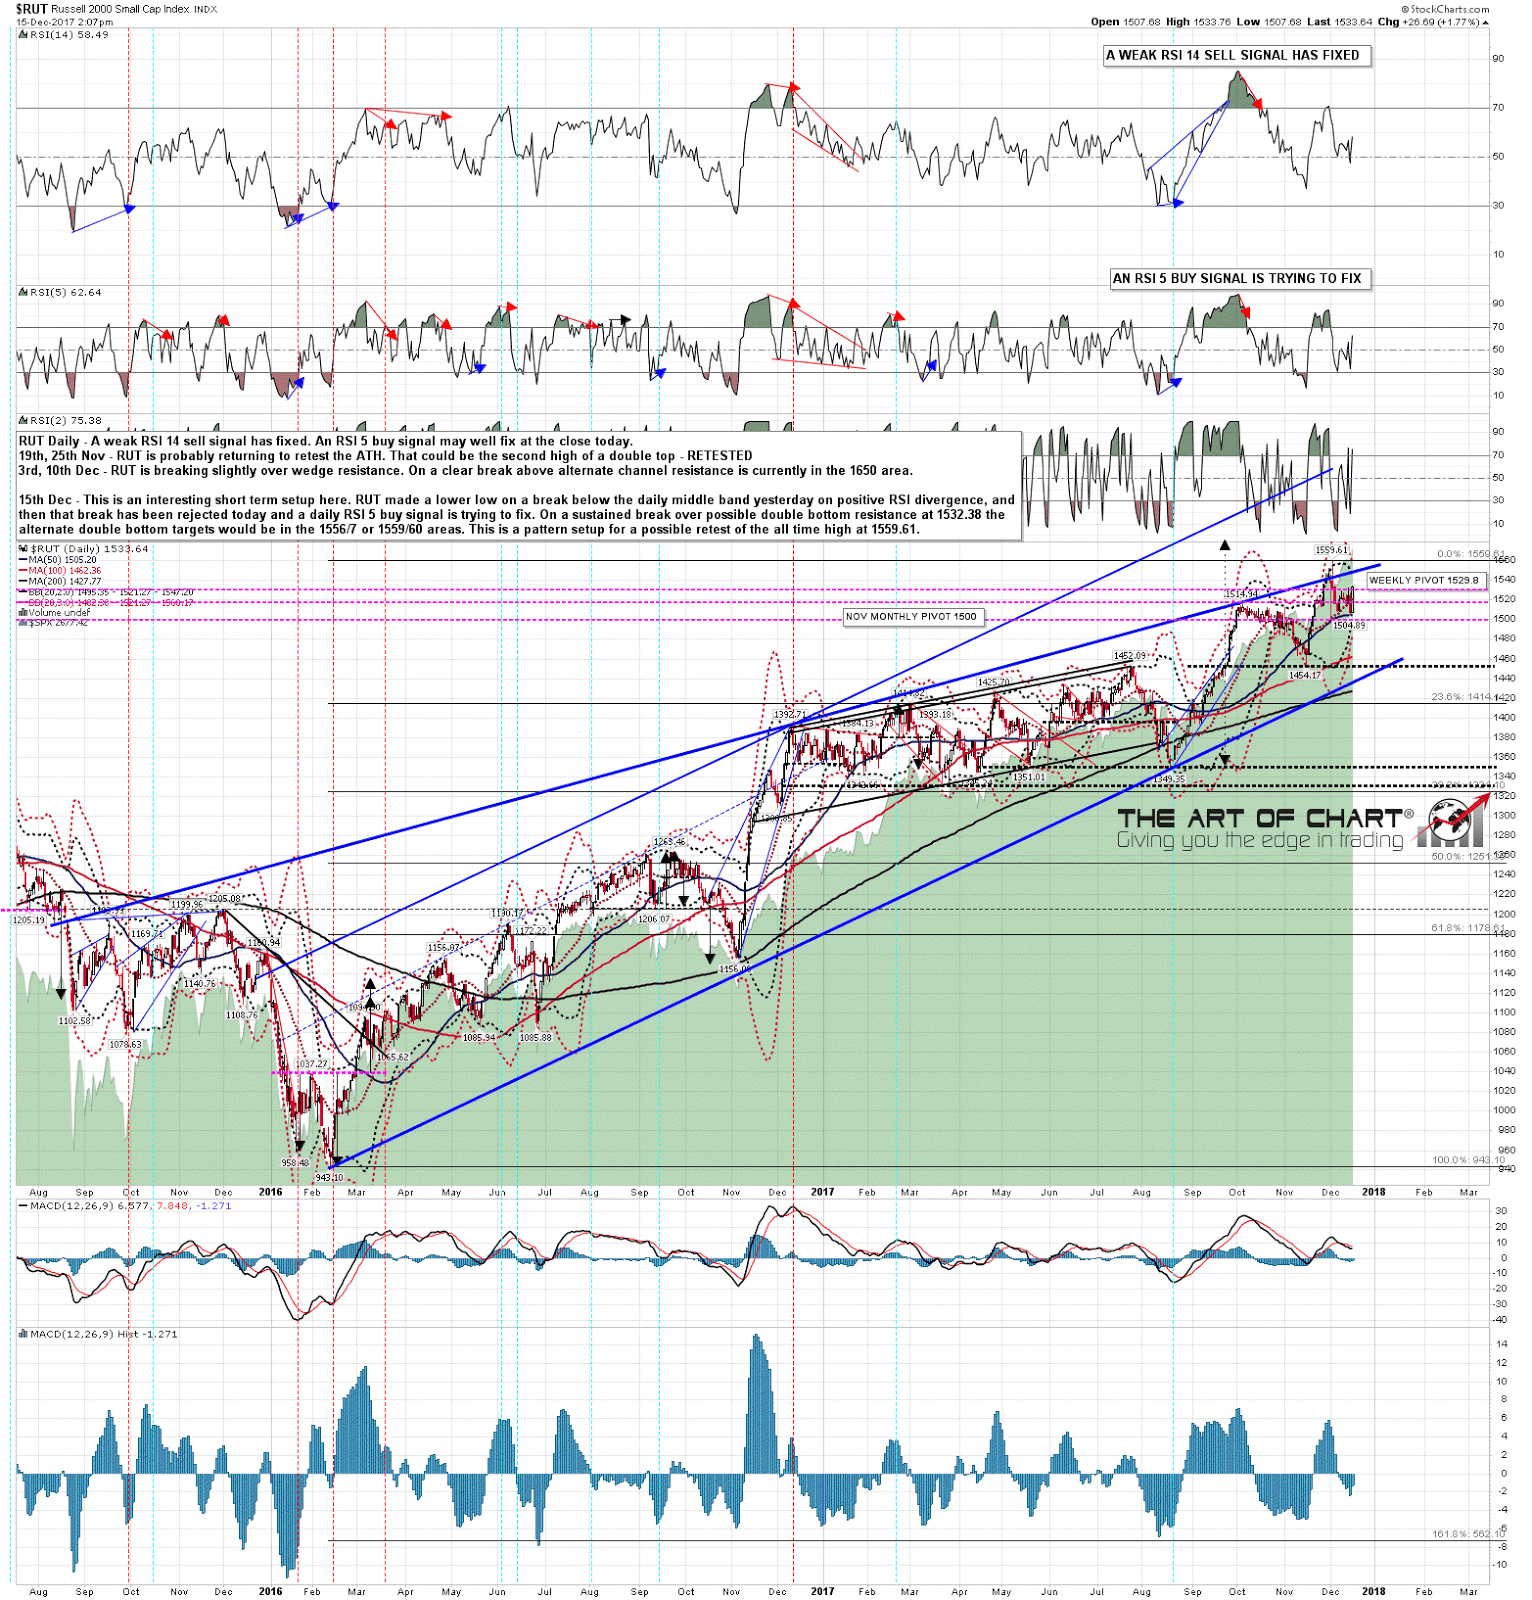
What I’ve been looking at since I did the video is the very interesting setup on RUT here, as it had barely moved all week before moving down yesterday to break the last low and the daily middle band. That lower low was on positive RSI divergence, and at the close today, RUT may well fix a daily RSI 5 buy signal, with a full rejection candle today against yesterday’s decline and a nice little double bottom set up that on a sustained break over 1533 looks for in effect a full retest of the all-time high. If that delivers then we may well see NQ make my resistance trendline in the 6530 area and a test on ES of 2700 before the December high, which we are expecting sometime next week. RUT daily chart:
TGIF. Everyone have a great weekend 🙂
 15th Dec 2017