I posted my premarket video today as I haven’t done that in a while, and in part that’s because I’m not well and trying to protect my voice today, so it makes sense not to do an intraday video today.
The analysis of equity indices is at the start of the video and I’ve left in the other sixteen instruments I cover every morning in these premarket videos at theartofchart.net. If you’re interested, there are interesting things happening on DX & USD pairs, CL, GC, ZB, and HG particularly.
Premarket Video – Update on ES, NQ, TF, and CL, NG, HG, GC, ZB, DX, EURUSD, GBPUSD, USDJPY, USDCAD, AUDUSD, NZDUSD, KC, SB, CC, and ZW:
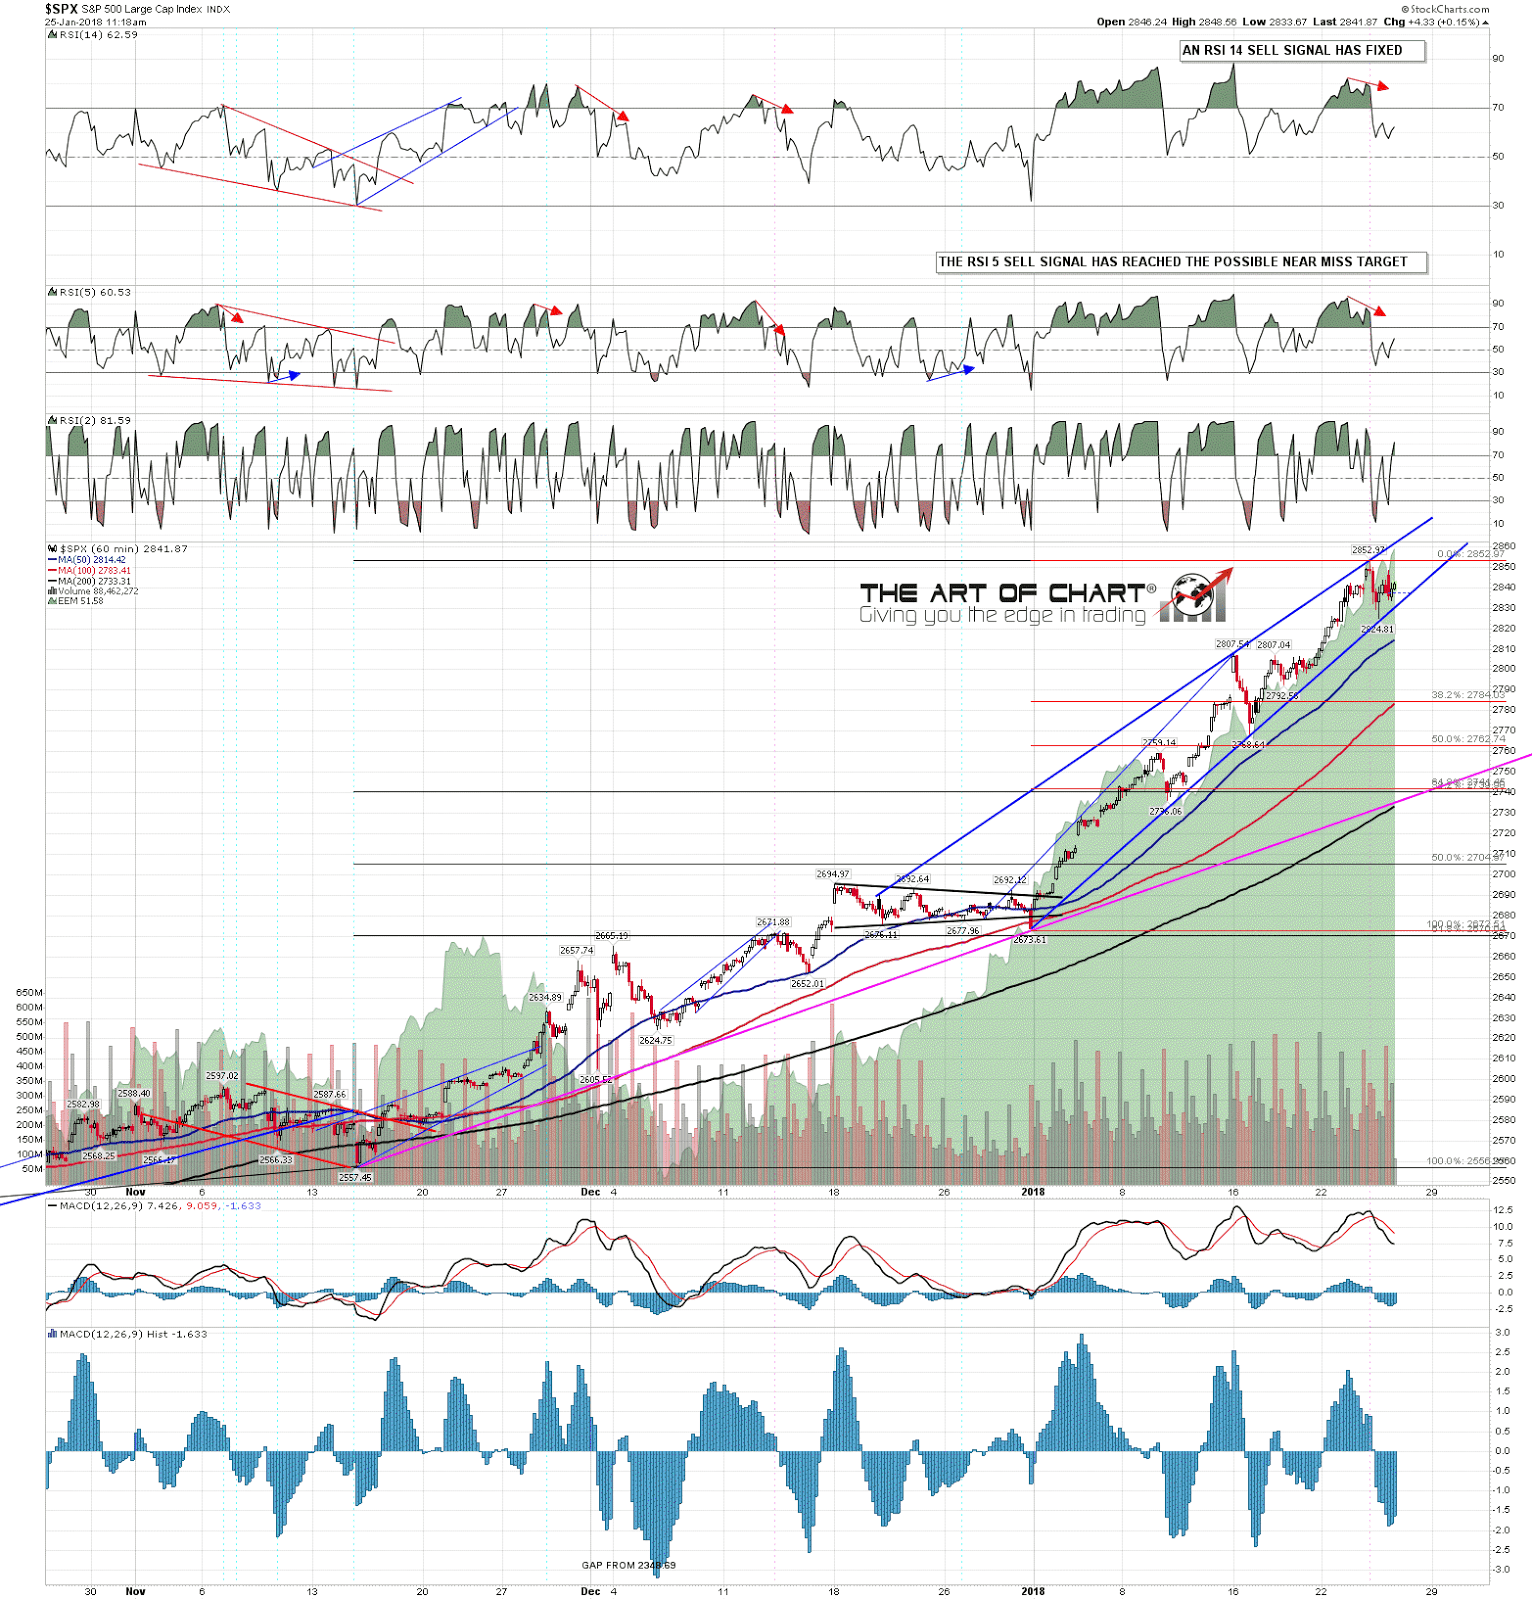
I haven’t been showing enough SPX charts recently, so here is what the rising wedge looks like on the SPX chart. Forming nicely, and wedge support is now in the 2831 area. Wedge resistance is now in the 2862 area and would be the obvious next target if wedge doesn’t break first. 60min RSI 14 sell signal fixed and I’m leaning towards at least a retest of the ATH even if SPX is topping out short term. SPX 60min chart:
 25th Jan 2018