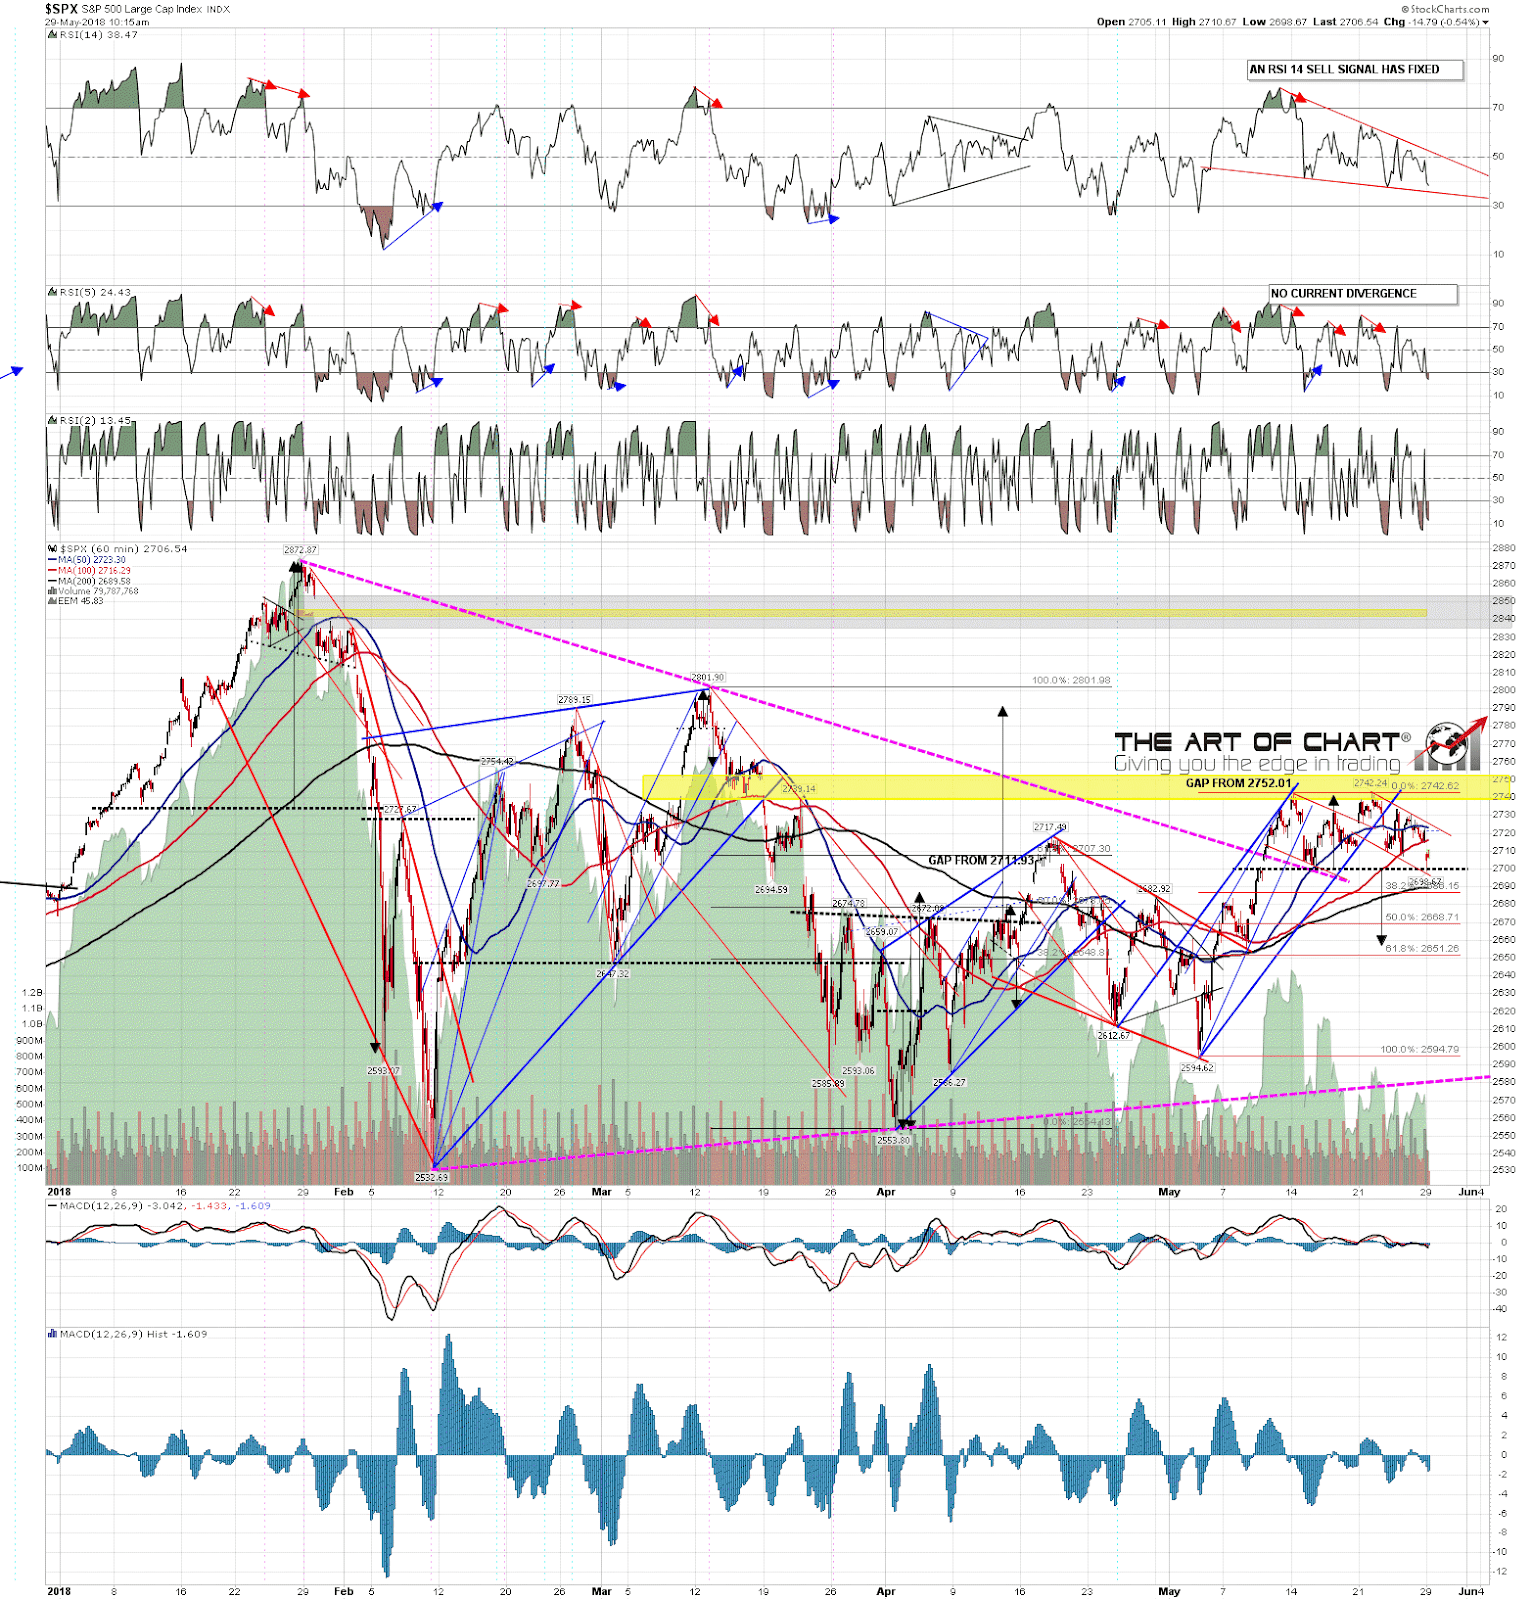
Interesting setup on SPX here as the holiday week begins. SPX is now testing the larger double top support that I was looking at last week and has broken slightly below double top support at the open. From here there are only two high probability options.
The first option is that SPX continues down towards the double top target in the 2661.50 area. A sustained break below 2690 from here likely seals that for the bears. The second option here is that the double top fails and rejects at the break. That’s what I would call a Janus bull flag setup, and the target would be a full retest of the May high at 2742.24. A strong break back over weekly pivot on SPX at 2723.65 likely seals this for the bulls, though by that stage SPX would be most of the way back to 2742.24 of course. As a general rule I’d expect to see one or the other target reached this week.
Full Premarket Video from theartofchart.net – Update on ES, NQ and TF, and CL, NG, GC, HG, ZB, KC, SB, CC, ZW, DX, EURUSD, GBPUSD, AUDUSD, NZDUSD, USDJPY, USDCAD:
In the video I mention that the downside scenario is supported by the ascending triangle on ES having clearly broken down, though these aren’t great at making targets, and that there are still open 60min RSI 14 sell signals on SPX, NDX and RUT. I have been assuming that these would make target after a test of 2760-70 on SPX, but they could do that now instead of course.
Overall the pattern and RSI structure here favors the bears at this inflection point, and the EW structure favors the bulls. May the best structure win! 🙂
SPX 60min chart:
Our monthly free public Chart Chat is next Sunday 3rd June at 4pm. We’ll be reviewing the usual wide range of instruments across equity, bond, forex and commodity markets. If you’d like to attend you can register for that on or June Free Webinars page.
 29th May 2018