I was talking about on Tuesday about the likely short term high forming here and that process is now further advanced and possibly finished, though I think that the odds favor another short term high retest before the retracement that should follow.
Just to recap, we are expecting a short term retracement to follow, lasting perhaps a week and taking SPX back into the 2750-70 range before another leg up starts that might carry SPX up to the all time high retest.
In the short term an hourly RSI 14 sell signal has now fixed and a daily RSI 5 sell signal is brewing. Key short term trend support is at the 50 hour MA, currently in the 2798 area, and if we see a high retest from here I’d expect that to be the second high of a small double top. SPX 60min chart:

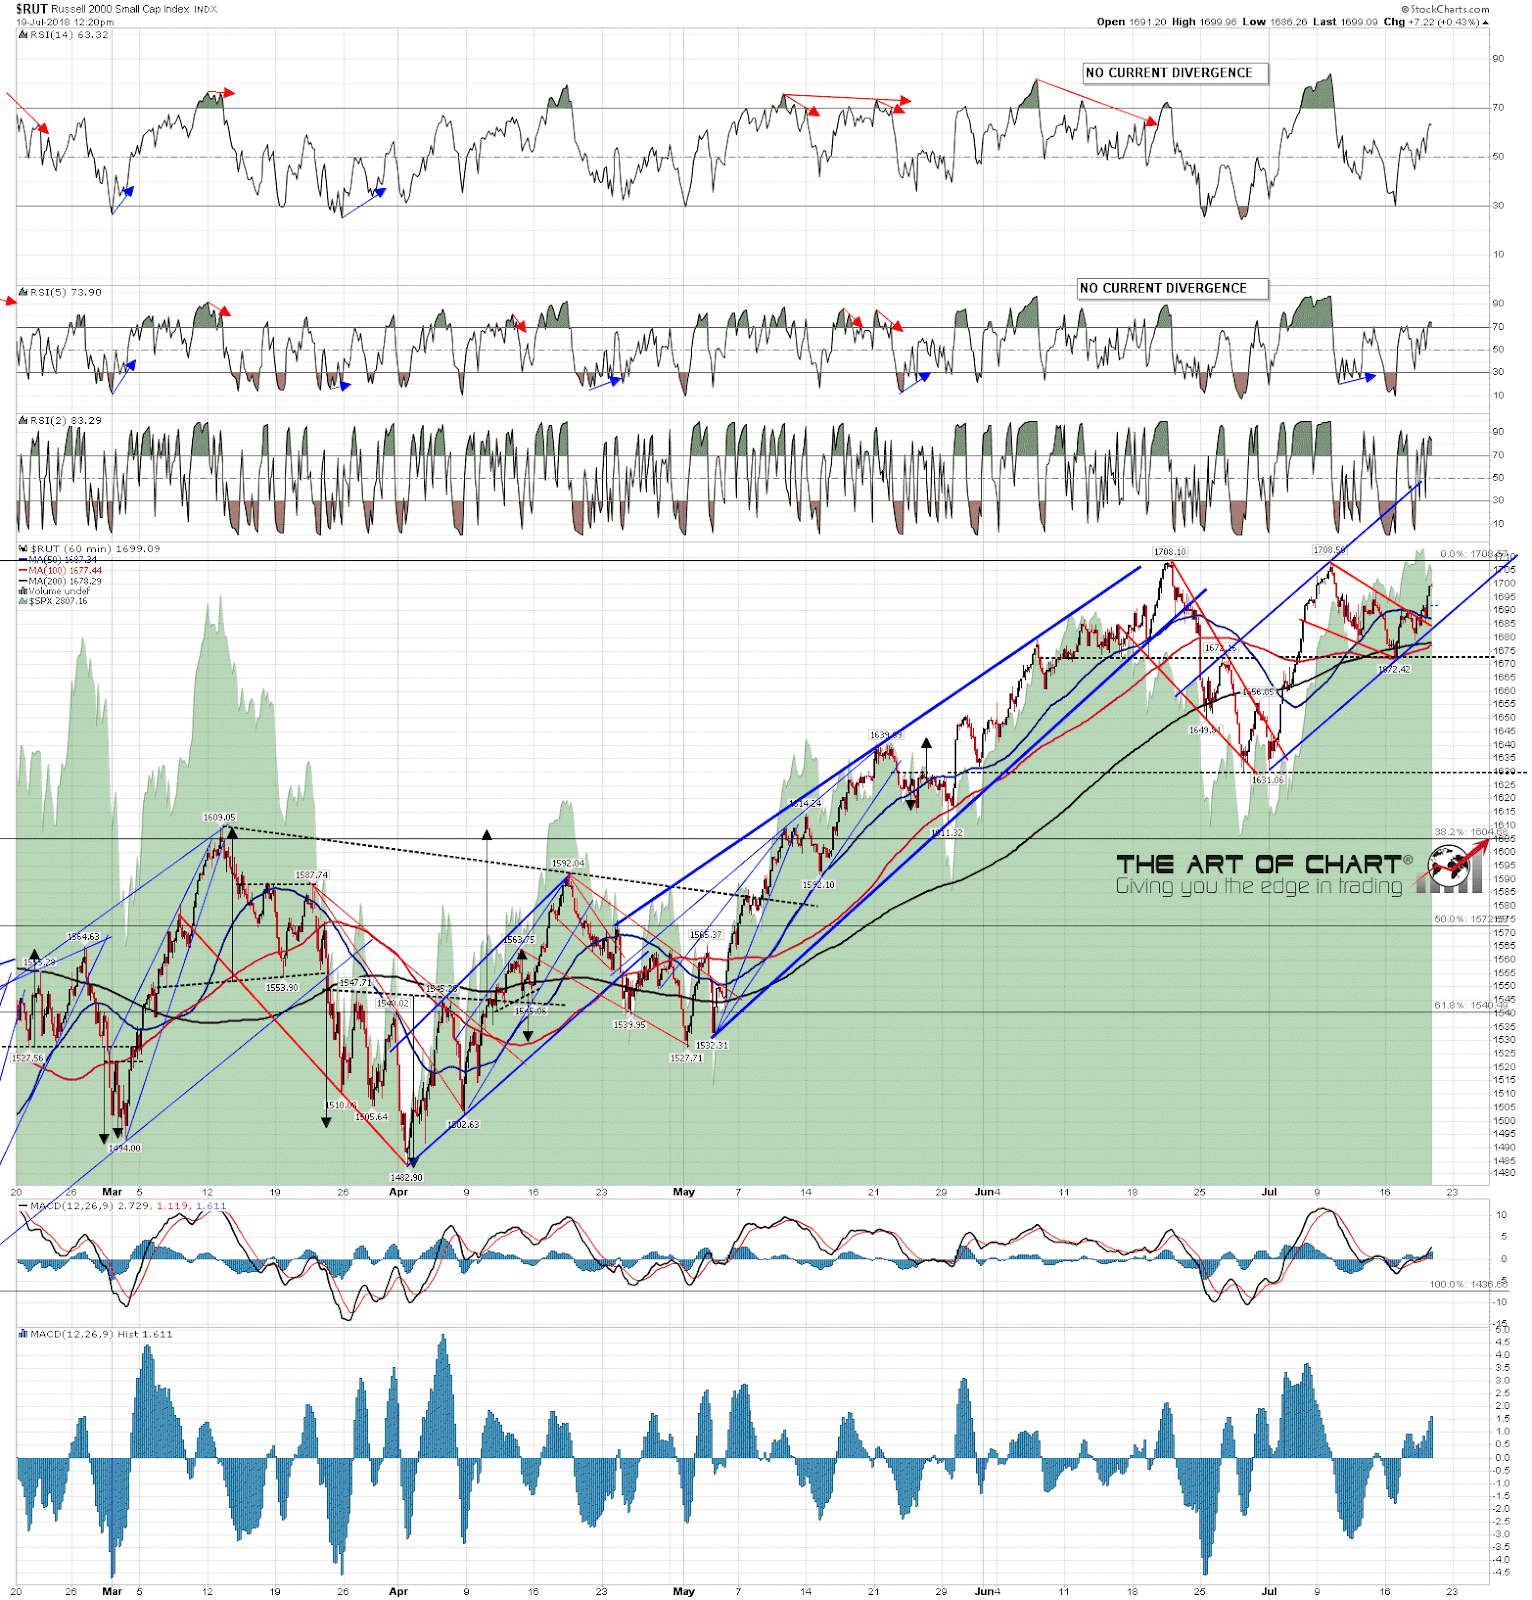
Why am I looking for a short term high retest? Well there is the lack of a decent initial reversal pattern but there is also the setup on the RUT chart below with a clear bull flag wedge having broken up with a minimum target at the ATH retest not far above. That isn’t a huge move but this is a reliable pattern and I’m expecting this to deliver. While the correlation between SPX and RUT is somewhat variable, a short term high retest on SPX is the obvious thing to see while this plays out on RUT. We’ll see whether that delivers. Any sustained break below 2800 SPX would obviously throw this into serious doubt. RUT 60min chart:
Stan and I are doing our monthly free public webinar on the Big Five and Key Sectors an hour after the close tonight. This is looking at AAPL, AMZN, GOOG, FB, NFLX, TSLA & IBB, IYR, XLE, XLF, XLK, XRT. If you’d like to attend you can register for that on our July Free Webinars page.
 19th Jul 2018