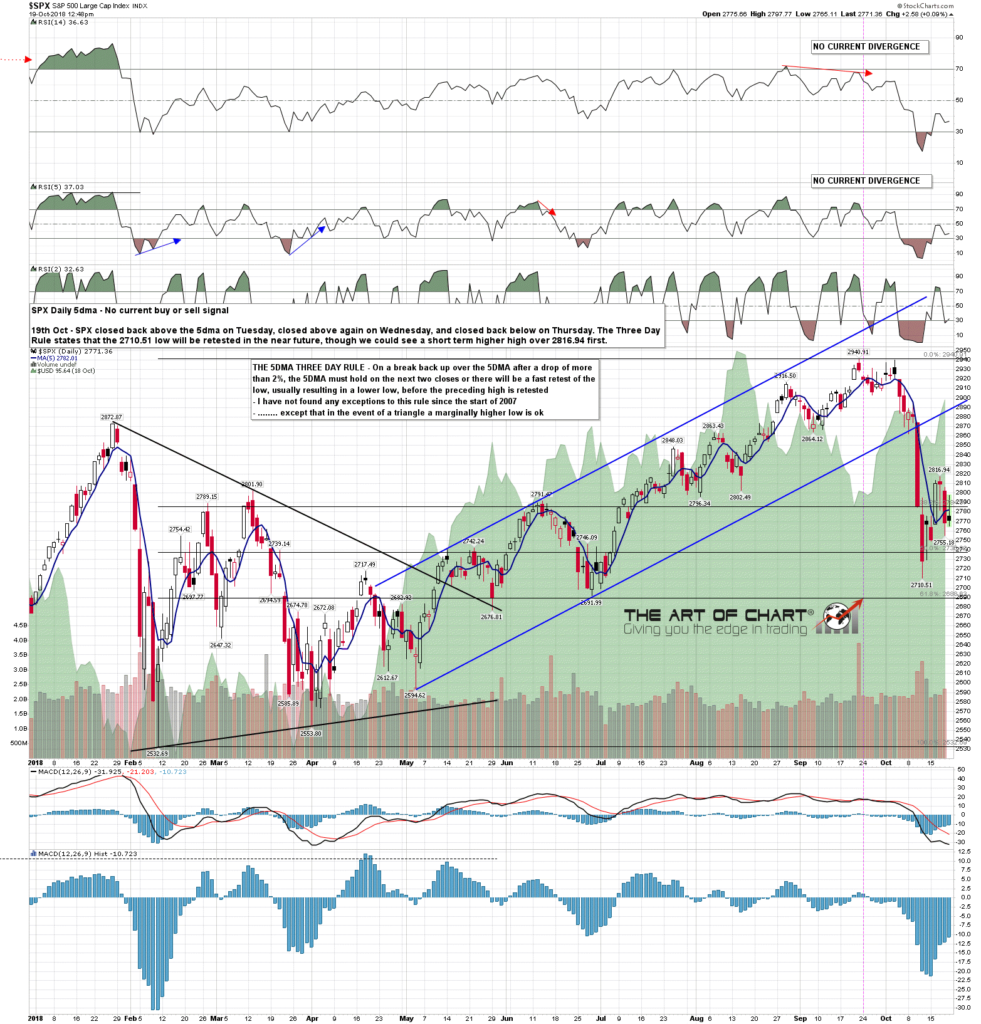
It has been a while since we have seen a Three Day Rule signal fix, in part because the rule requires an initial 2% decline, and those have been pretty rare over the last couple of years, but the Three Day Rule triggers when there has been a minimum 2% decline on SPX and then SPX closes back over the 5 day moving average. That is day one, and that happened on Tuesday. The rule looks at the next two days and if there is a close back below the 5dma on either day then the rule fixes. That close back below happened yesterday, on day three. On this statistic we could see a fairly marginal high over the current rally high this week, but whether we see that or not, SPX should retest the low at 2710 in the near future. The only exceptions to this rule since the start of 2007 were two instances when an overall triangle was forming, and rather than a full retest of the previous low there were marginal higher lows over that low in the next few days.
This is the highest probability stat that I follow, and SPX is very likely to retest the 2710 low in the next few days. SPX 5dma chart:
After that retest of 2710, what then? Well we could find support in that area or continue directly down towards the obvious bigger picture target in the 2500-50 area. We’ll see when we get there. Stan is leaning 50/50 on that and I’m leaning 65/35 towards the downside targets. SPX weekly chart:
On the short term chart I’d love to see that higher high into the 50% retracement in the 2825 SPX area, but there was significant failure this morning to convert the weekly pivot at 2790 SPX into short term support into a higher high, and SPX may head down directly from here. If we do see that marginal higher high, I’d expect that early next week, and it would be a very appealing short entry area. SPX 60min chart:
So why the title today? Well I just wanted to add that a 15% or 20% retracement of the kind that we may well be seeing here may feel like the apocalypse has arrived, but that’s just because this has been such a long bull move. In truth a sharp retracement to the mean every so often is a sign of a healthy market, and it should be remembered that every retracement of any size on SPX historically has resolved to the upside. In the longer term the bulls always win. That doesn’t apply on every market, tulip bulls have been waiting a while since the bottom fell out of that market in 1637, and they may be waiting a while longer, but US stocks aren’t tulips. The reaper here isn’t the herald of apocalypse, it’s just the guy who mows the lawn.


 19th Oct 2018