The close on SPX yesterday was a clear close back over the 5dma, and as it has been a decline of more than 2% since the last break down, that puts SPX back on the Three Day Rule. That means that if SPX should deliver a clear close (4/5+ handles) back below the 5dma, currently at 2684, today or tomorrow, then SPX would very likely retest the October low in the following few days.
When SPX is trending in either direction I watch the 5dma and the 50 hour MA for trend support or resistance. The 50 hour MA is currently in the 2694 area, so that and the 50dma give us the short term support area.
On the resistance side there is a possible IHS neckline in the 2725 area, and that’s still in play potentially if SPX breaks back under the 2685-95. That would have an ideal right shoulder low in the 2651/2 area, but in practical terms in the event of a daily close back under the 5dma SPX would likely deliver at least a new retracement low.
Higher resistance and a very possible target area for this rally if reached quickly are the 200dma and daily middle band, both currently at 2765, and the 50% retracement of the decline from the ATH in the 2772 area.
Our overall lean here is that we are expecting this rally to pull back shortly, very possibly into the 2680-2700 area, then go higher, very possibly into the 2760-70 area. SPX may well then fail into a new retracement low before the main rally begins. This current rally would therefore be what we would normally describe as ‘the high before the low’.
It is possible though that the short term low may be in. I’d note that the daily stats lean bullish every day between now and FOMC next Wednesday, and there is already a possible asymmetric double bottom that has broken up with alternate targets in the 2785 and 2810 areas.
Stan and I are doing our monthly free public Chart Chat on Sunday this week, and obviously that’s likely to be an interesting edition. If you’d like to attend, you can register our November Free Webinars page.
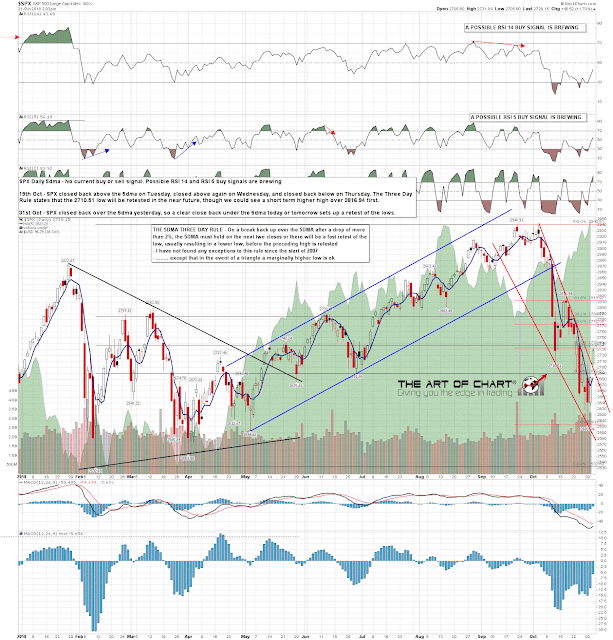
SPX daily 5dma chart:
SPX 60min chart:

 31st Oct 2018