The first move down on equities has delivered nicely, and at this point the time has come for the rally that is in progress at the moment. Now on the bigger picture this is an inflection point test of trend resistance, and the alternate inflection point outcomes are either a failure at resistance into another leg downwards, or a break and conversion of resistance back to support, opening another retest of the all time high.
On SPX resistance is at the weekly pivot at 2820, supported by the key short term trend support/resistance levels at the 5dma, currently at 2820 and the 50 hour MA, currently at 2825. We should either see failure in this area, or a break back up into the high retest. I discuss the options on this morning’s premarket video. Since then the 60min buy signals on ES, NQ and RTY have all either made target or the possible near miss target.
Full Premarket Video from theartofchart.net – Updates on ES, NQ, RTY, DAX, ESTX50, SPX, NDX, RUT, CL, NG, GC, SI, HG, ZB, KC, SB, CC, ZW, ZC, ZS, DX, EURUSD, USDJPY, USDCAD, AUDUSD:
On SPX there is a concerningly (for bears) solid looking low setup yesterday. There is an open double bottom target at 2835, not yet reached, and a decent quality overall rising channel from 2722 was established at yesterday’s low, which also respected an important open breakaway gap from 2784, which obviously remains to be filled on another leg down. The hourly RSI 14 sell signal has not yet reached the possible near miss target, and there are still daily RSI 14 and RSI 5 sell signals on the ES chart. SPX 60min chart:

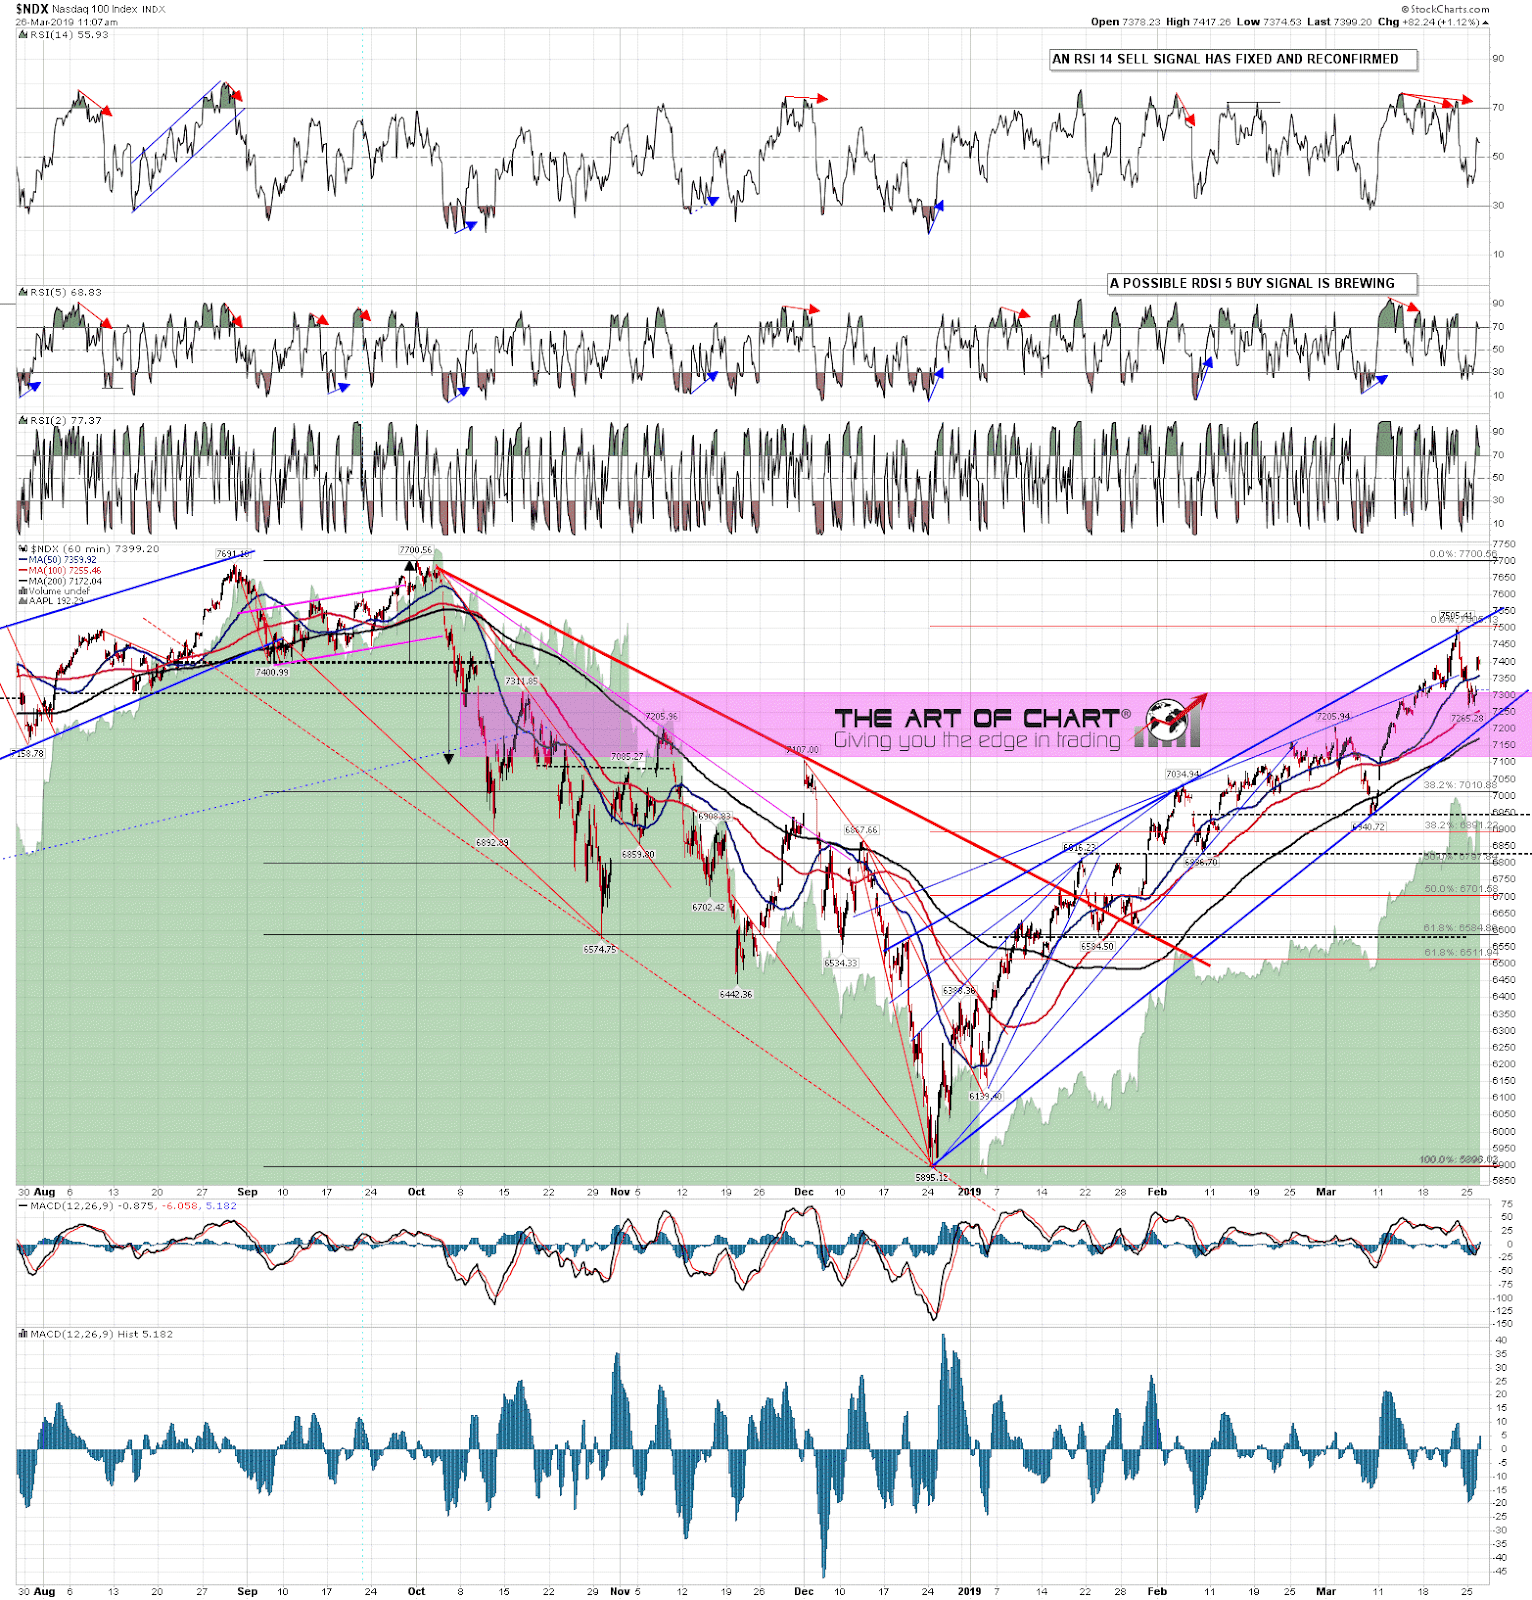
On NDX the obvious next target is rising wedge support, currently in the 7205 area, and that has not been reached. The hourly RSI 14 sell signal has also not yet made the possible near miss target and if we were to see a rally high retest from here I’d be leaning strongly towards that being the second high of a double top. NDX 60min chart:
The setup that should concern bears most here however is on RUT/RTY. On RUT there is a very decent looking falling wedge forming that might well be a bull flag. The wedge is a perfect flag channel on RTY (RUT futures) so they are telling the same story. There is an obvious setup to retest the rally high here on RUT and if that happens then I’d expect similar retests on SPX and NDX, and perhaps higher. RUT 60min chart:

Cycles aren’t favoring the all time high retest here yet, but my monthly middle band stat is favoring seeing that retest this year. SPX is not far from the all time high though and every marginal higher high increases the chances that we might see that sooner than expected. We shall see. I’m estimating the odds of this just being a backtest at 70/30 in favor on the overall setup, but with a solid 30% chance of a break up into that rally high retest. If we see the next leg down I have the next serious possible support levels in the 2760 and 2720 areas.
Stan and I are doing a webinar tomorrow on setups and approaches to trading commodities. If you’d like to attend, you can register for that on our March Free Webinars page.
 26th Mar 2019