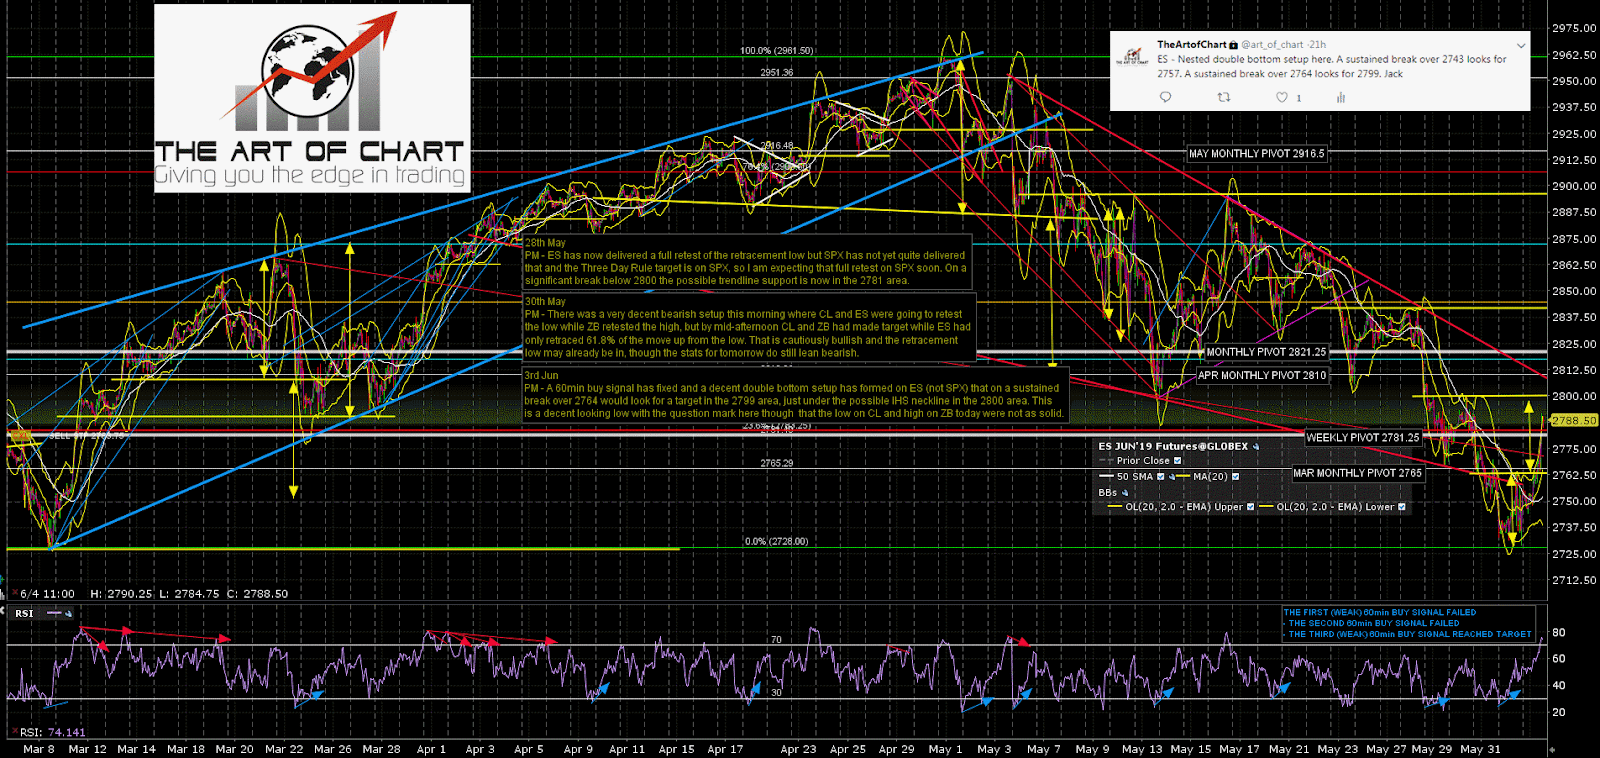
In my post ‘Important Support Breaks’ on 2nd May, as SPX was starting to break down after the new all time high, I was talking about the ideal retracement target at the possible H&S neckline in the 2722 March low area. SPX bottomed out yesterday at 2728 and in practical terms that target area I gave has been hit. The low from there was decent and on the chart below I have inset the tweet I put on our (subscriber only) twitter feed just after that low calling the possible nested double bottom setup with an overall target in the 2799 area, and obviously that has been playing out since and is almost at target.
ES Jun 60min chart:
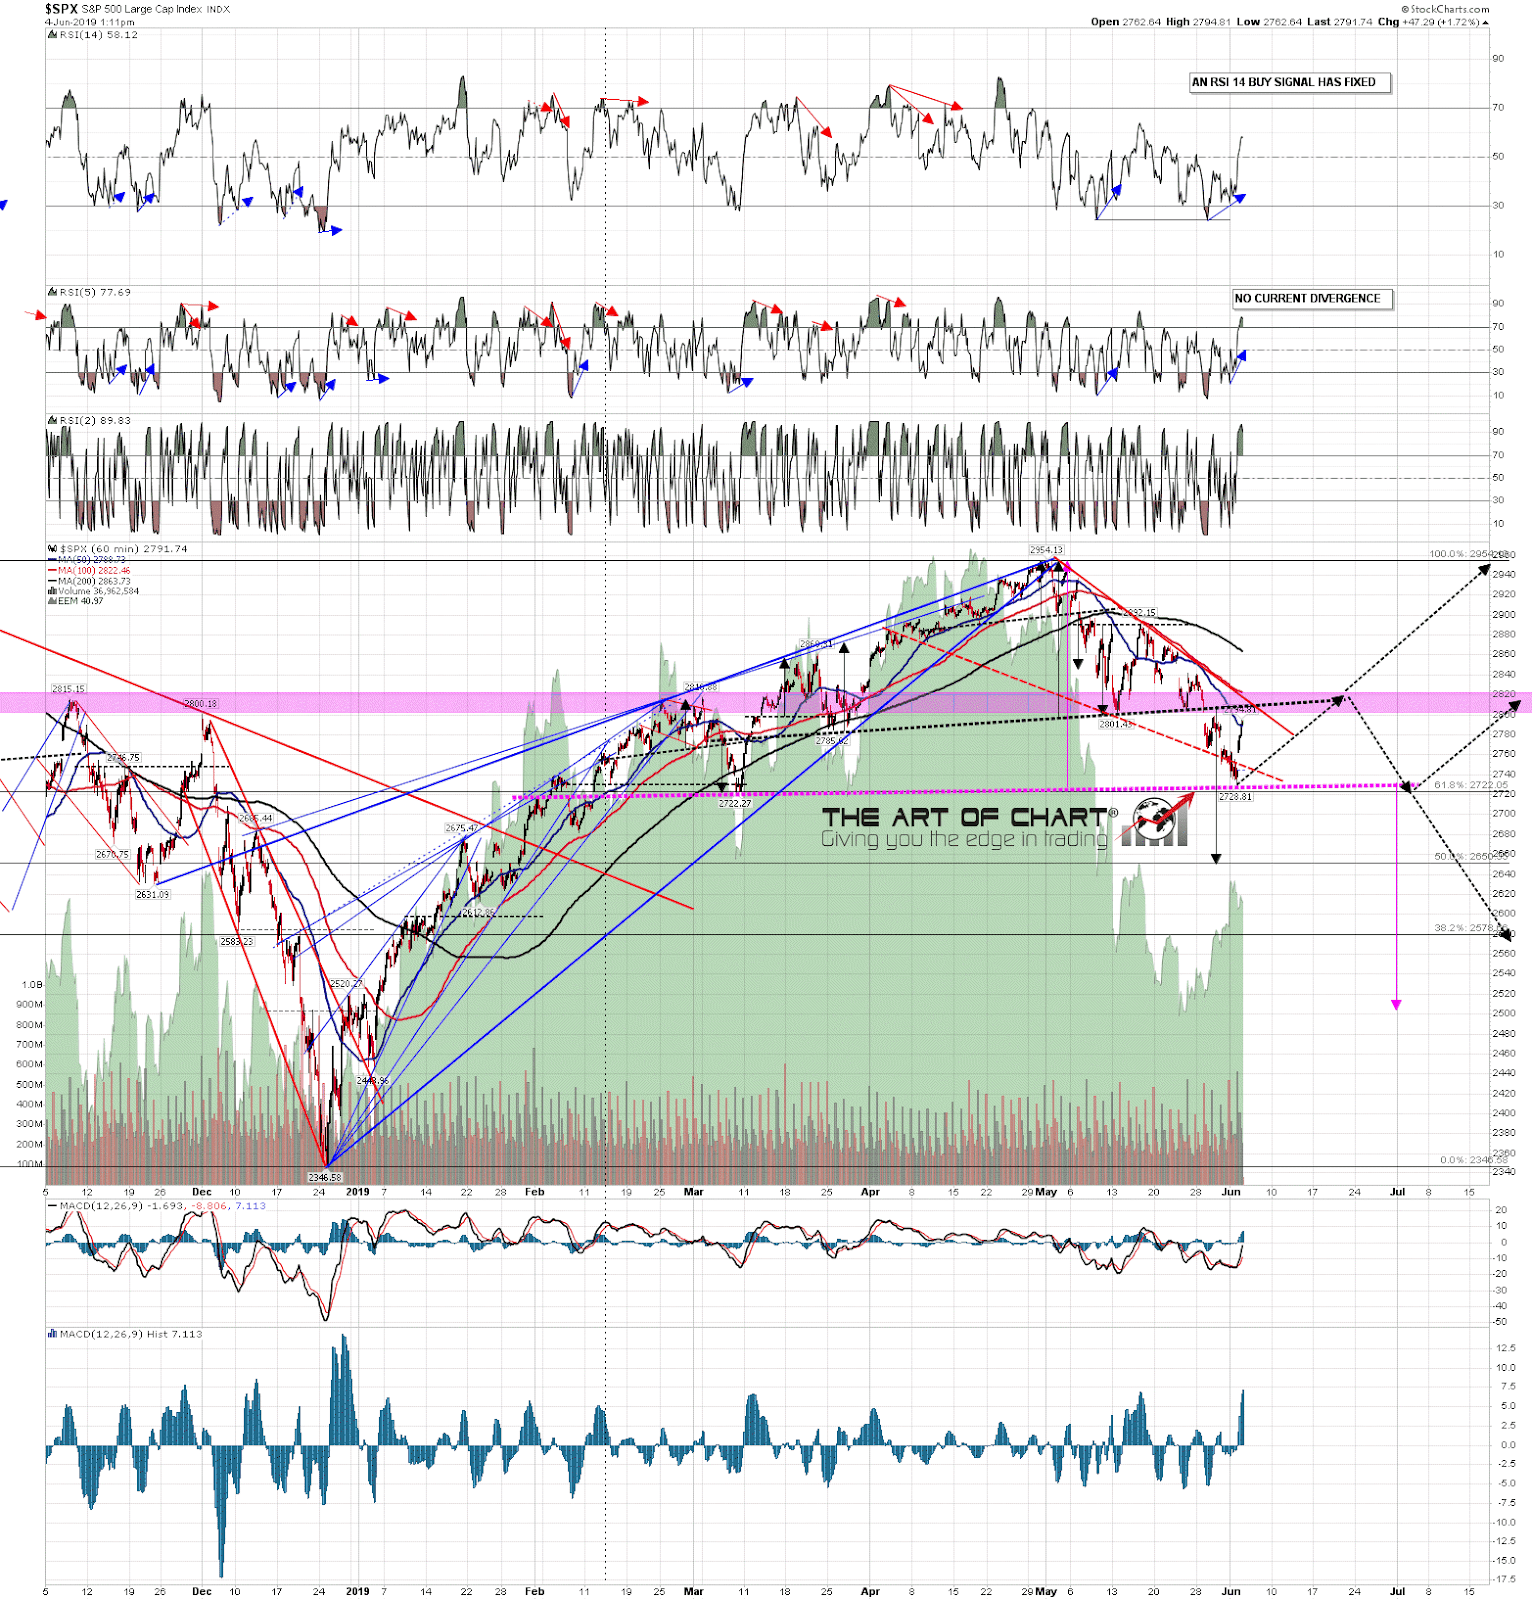
So what now? Well the two main options, assuming that SPX is now in a rally period into the next cycle high window in late June, are that either that larger H&S right shoulder forms over that period, with an ideal high area effectively at the SPX monthly pivot at 2819, or SPX makes a sustained break back up over the monthly pivot soon and then likely looks for another all time high retest. Either way, after June most likely SPX will go lower than we say yesterday.
Supporting the right shoulder scenario, the daily RSI 5 positive divergence on SPX and RUT was lost at yesterday’s close, so the buy signals that fixed after the low were hourly signals rather than daily. That isn’t supporting a big move higher, as most of those have already made target, though we could see that move in any case of course.
On the chart below I have drawn in the highest probability paths over the next few weeks with the key potential inflection points that I’ll be watching. I am favoring the H&S right shoulder scenario as long as monthly pivot holds as resistance, and also as long as the break down from the H&S after the right shoulder forms isn’t rejected hard after that break down.
SPX 60min chart:
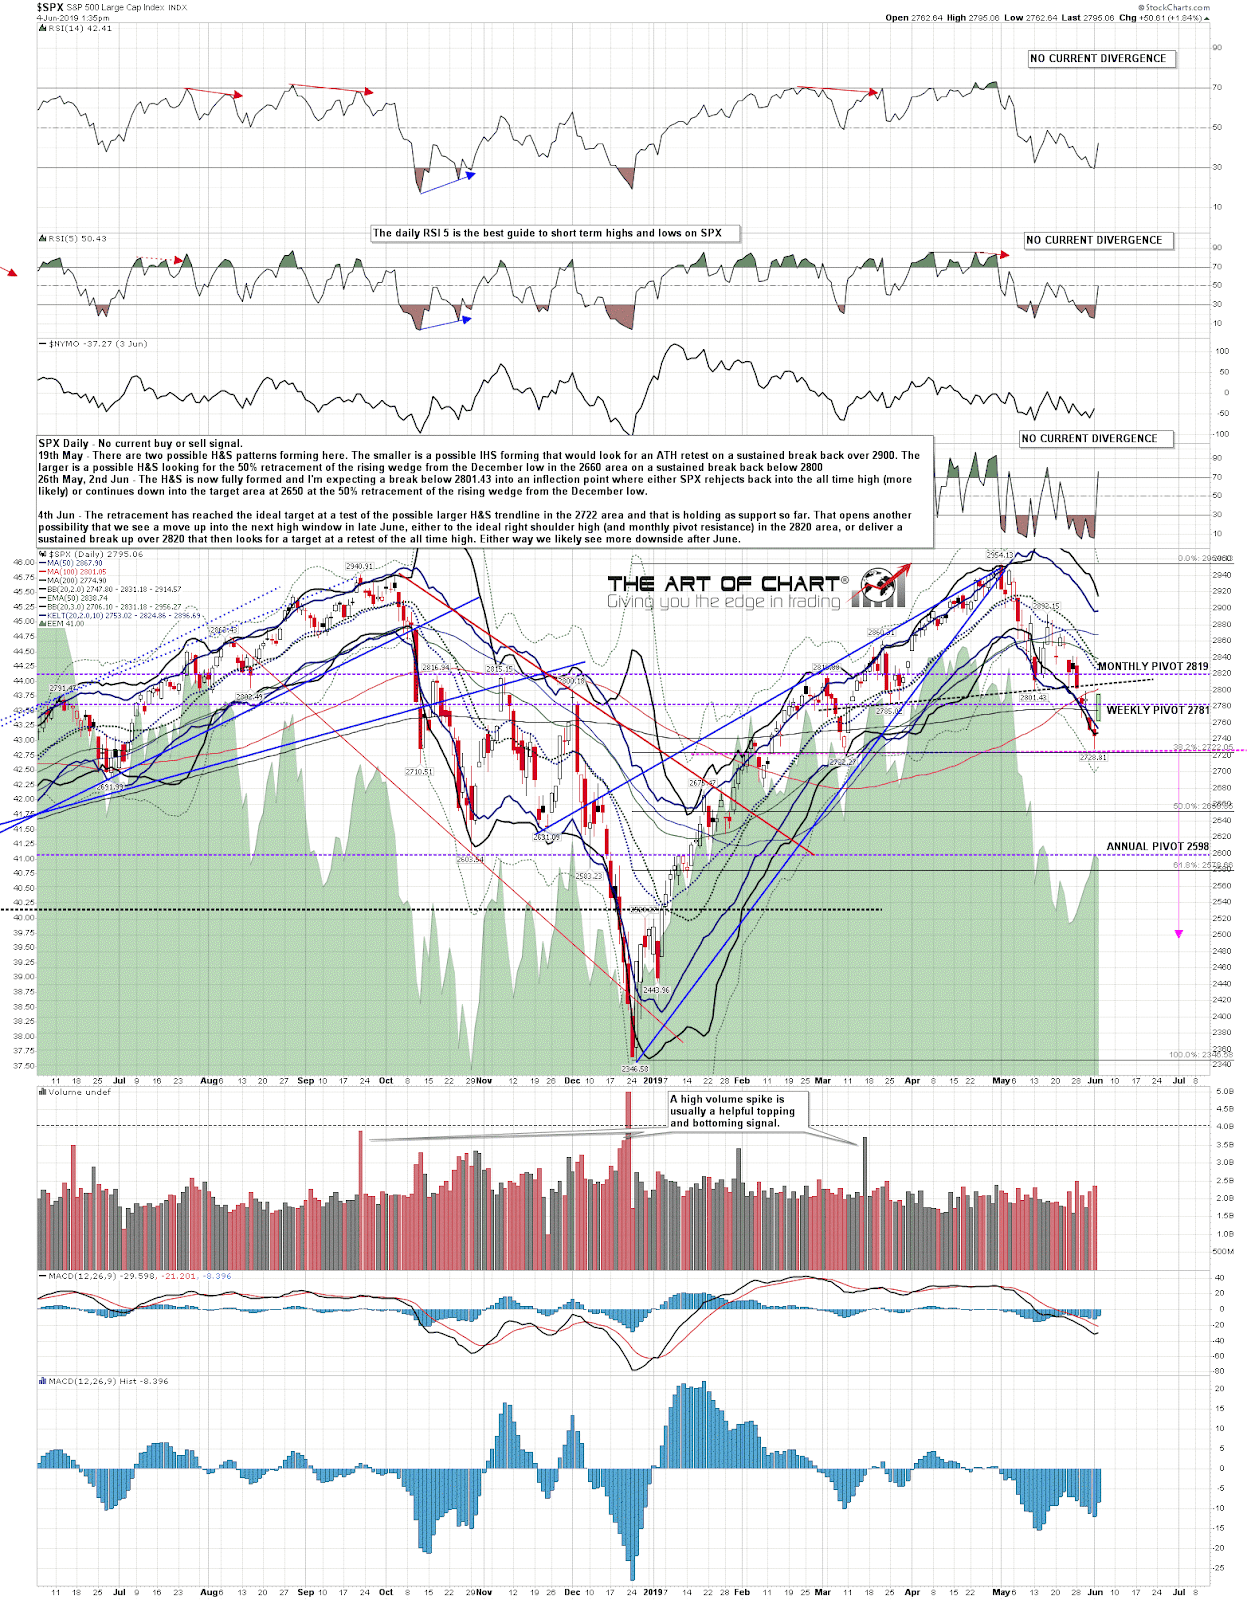
The weekly and monthly pivots are marked on the daily chart below, on which you can see that SPX has now reached the minimum 38.2% fib retracement target from the broken rising wedge from the December low. In theory SPX could head up directly from here into sustained new highs, but that isn’t the higher probability scenario in my view.
SPX daily chart:
Stan and I did our monthly free public Chart Chat on Sunday and if you’d like to see the recording that is posted on our June Free Webinars page. We run trading courses a few times a year covering swing and day trading and these are, even if I do say so myself, and as far as I can see, the cheapest and best available anywhere. We are starting our next course in a couple of weeks, and if you are interested you can see more details about that here. We run live trades as part of the course and on the last one I set up a CL trade live that on a minimum position made a minimum overall profit of $2k. I’ll be digging up the details on that for a post, but the course only costs $499 for non-subscribers. Just sayin’.
I’ve been very busy but I’m going to be trying to do two posts a week at minimum going forward. In the short term I’m expecting to see resistance in the 2795-2820 area and we may well be chopping around in the range between yesterday’s low at there for most or all of the rest of June.
 04th Jun 2019