As I was saying in my last post, SPX should be back into an upwards cycle by the end of October and that would be likely to end by the end of November. SPX has duly now made new all time highs and is likely to go higher. Let’s have a look at the most obvious target area.
On SPX the initial rising wedge from the 2346 low is likely expanding into a larger rising wedge. Rising wedge support is now therefore in the 2915 area. The obvious overall target would then be the original rising wedge resistance, now in the 3110 area, and due to be in the 3130 area by the end of November. I would note the interesting fibonacci relationship here, in that if you take the move from the December low to the June low, and then add the same again to the June low, then the sum is 3111, which strengthens this area as a swing high target.
SPX daily chart:
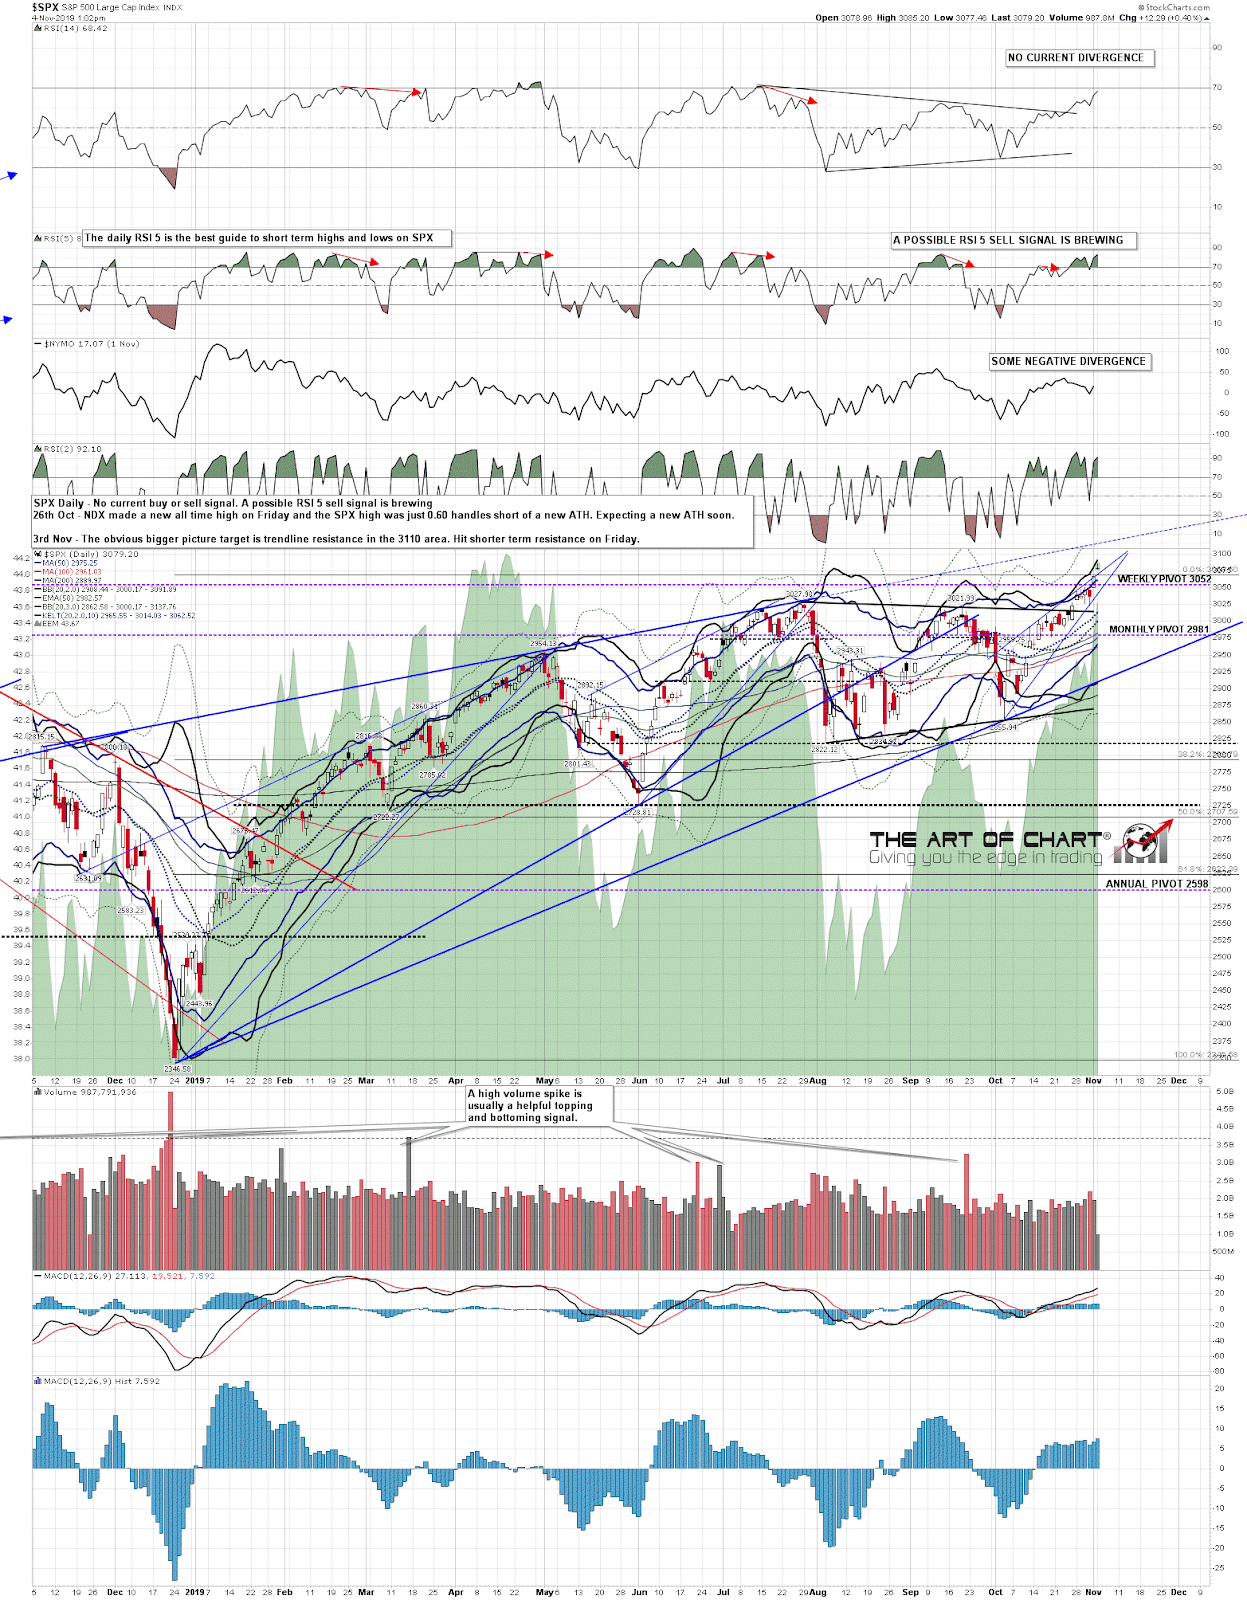
Obviously after the strong move up over the last two trading days that target area is pretty close, and it could be that we are going to see the first test of that soon and then spend the rest of November topping out. We’ll see.
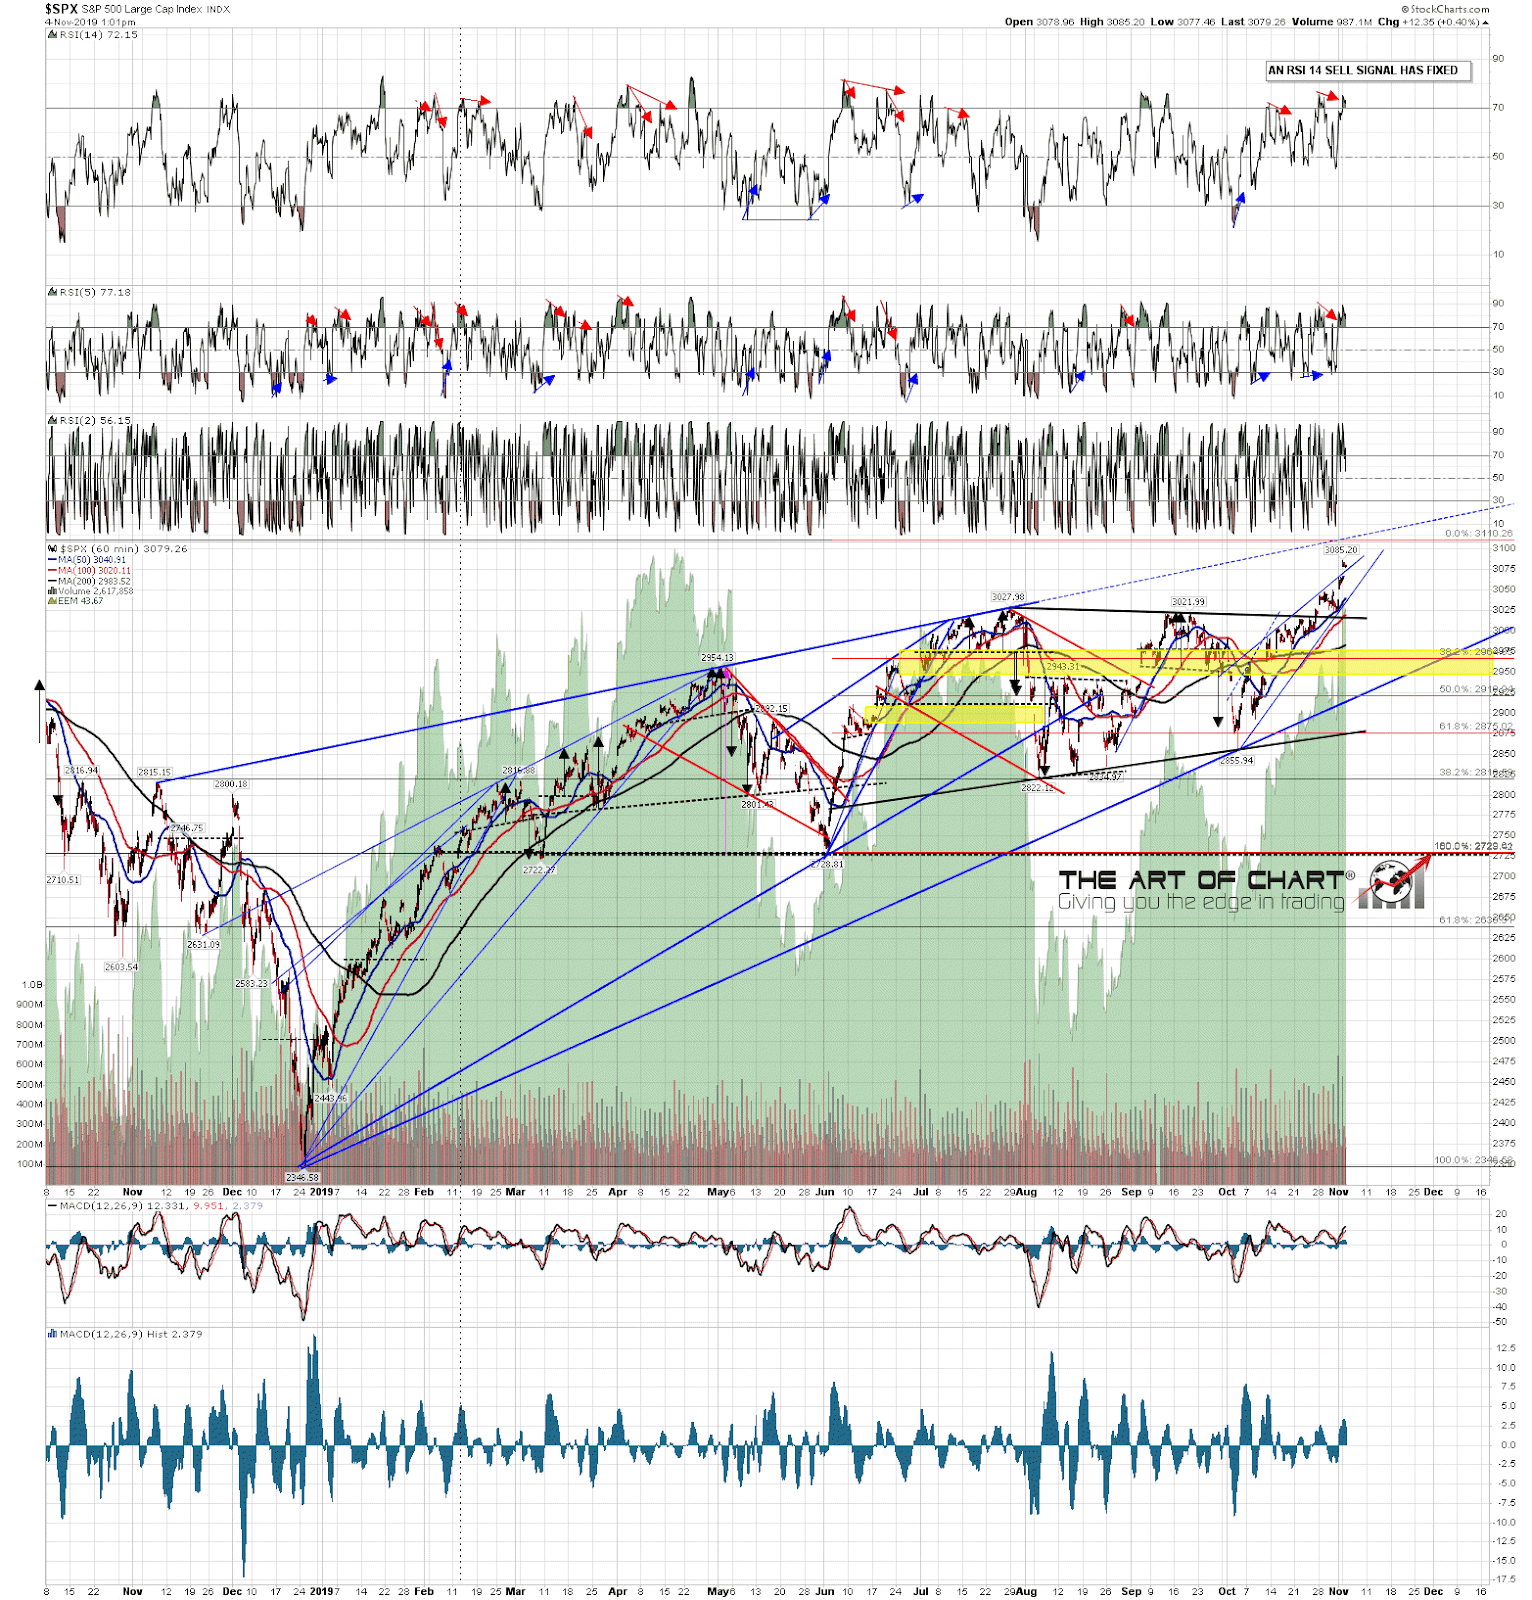
SPX 60min chart:
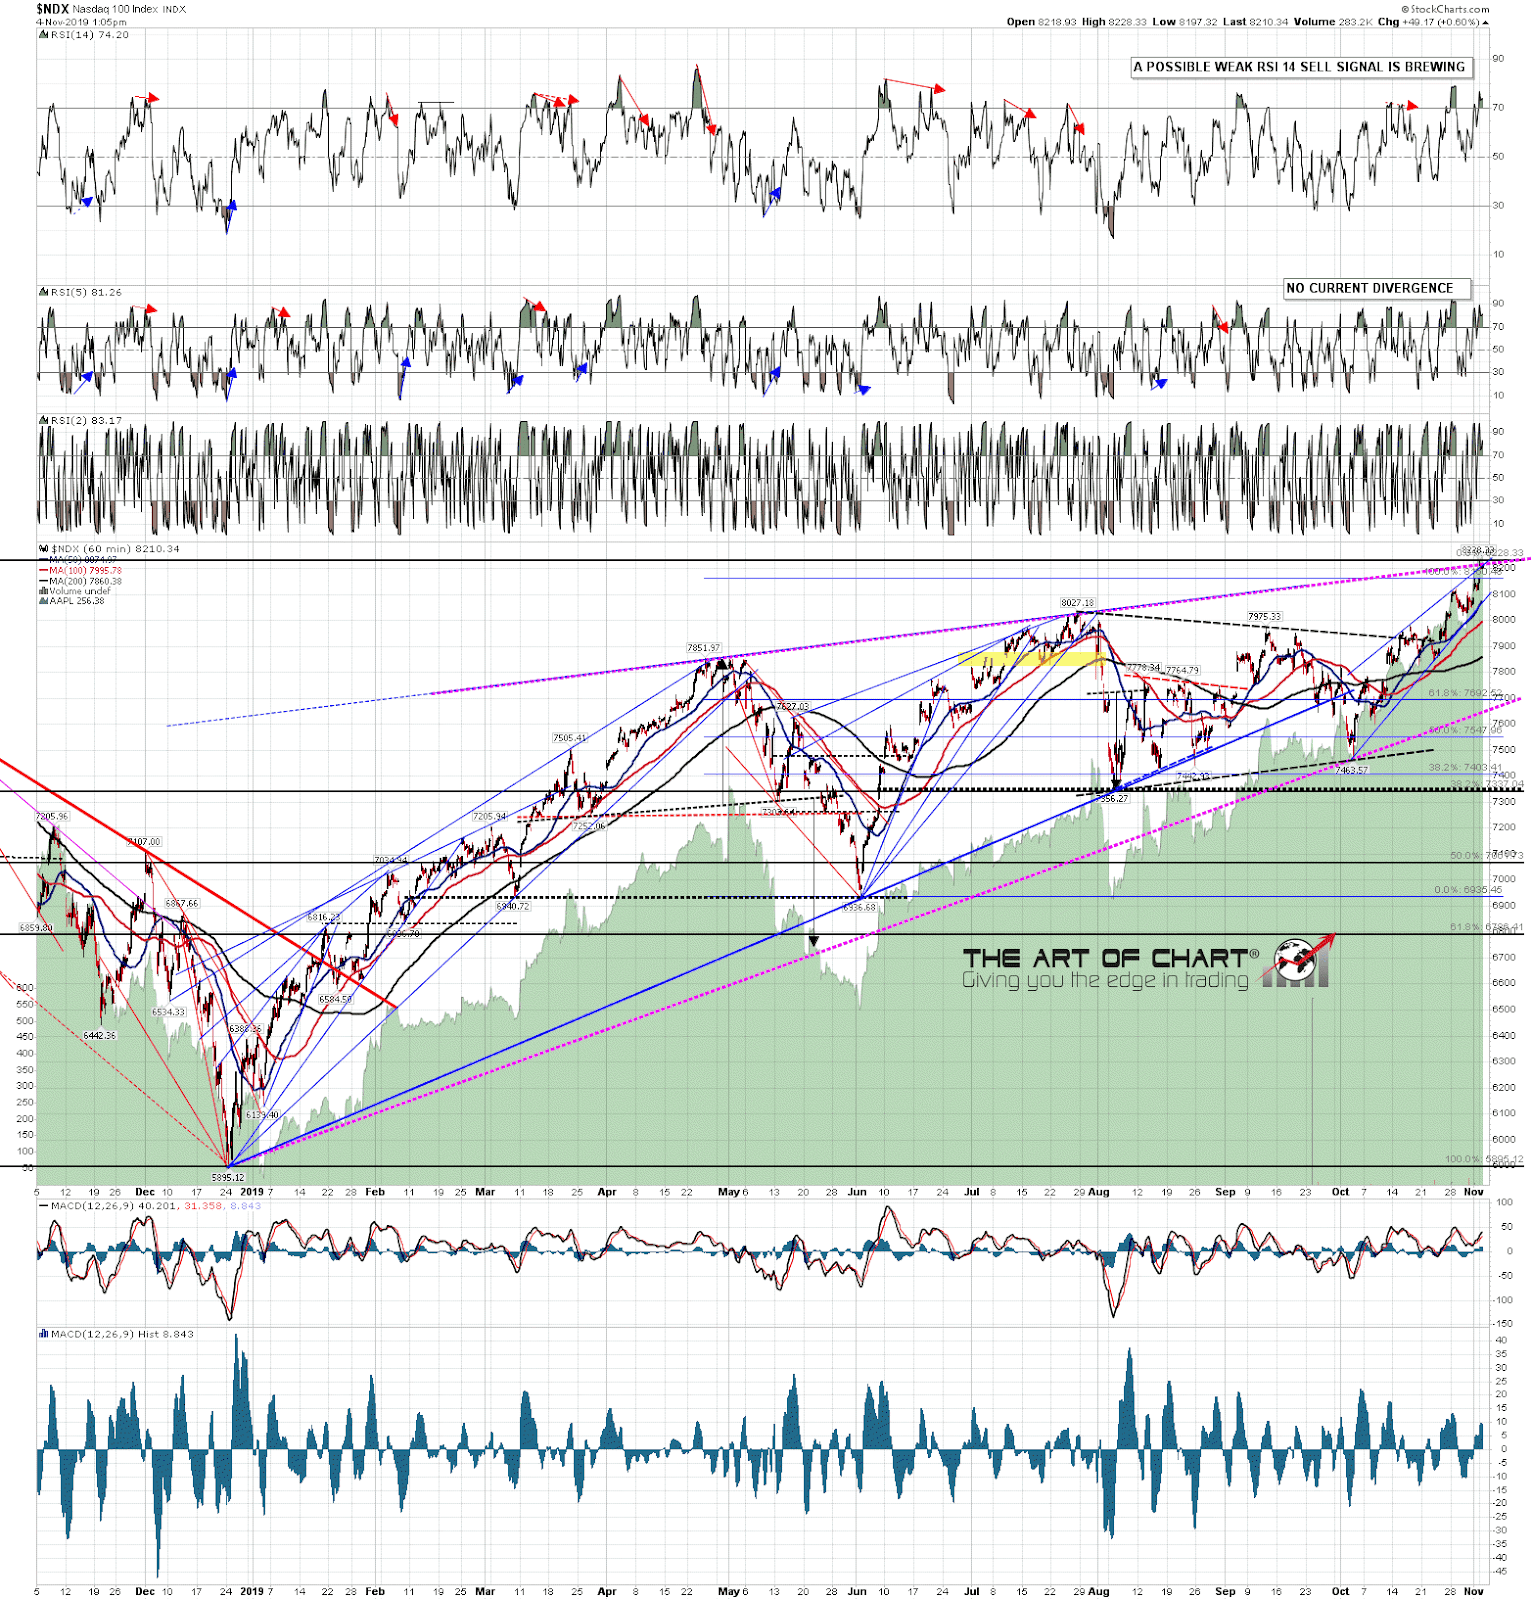
There is an obvious target for this move on NDX as well, and I was interested to see that was hit this morning. That could be the start of a bearish overthrow, or NDX could be expanding up into an alternate resistance trendline. What is obvious though is that at the close on Friday there was a lot of negative divergence on the hourly and daily charts and by the close tonight most or all of that divergence will have been lost. SPX and NDX may well have higher to go this week.
NDX 60min chart:
Stan and I are doing three free public webinars at theartofchart.net this week, all of which are well worth attending if you are so inclined, and all of which can be found on our November Free Webinars page. The first is after the close on Wednesday at 5pm EST, and is a special webinar with Striker Securities looking at the history of the futures and commodity markets. One for the market history buffs, of which I am definitely one. The second is after the close on Thursday again at 5pm EST, and is on ‘Trading Commodities – Setups And Approaches’. This is looking at some of the extremely interesting commodity trades setting up over the next year or two, in what is likely in my view to be the strongest of the main market groups over that period. The third is our monthly public Chart Chat on Sunday at 4pm EST. There we will be looking at the usual wide range of markets and instruments, and will be looking at the likely targets for the down move that we will be looking for after this current upward trend ends by the end of November.
 04th Nov 2019